
Aug 17, 2024
Fast, Stable, Secure. Meet Drive 2.0
The FieldView Drive 2.0 can send seed scripts without a thumb drive, has built-in GPS, offers faster data syncing and compatibility with a wider range of equipment.
Let’s take a look at what’s new with Field Region Reports, and how you can take advantage of the latest updates.
If you’re a Climate FieldView™ Plus or Premium user, chances are you’ve used Field Region Reports. As one of the most popular FieldView™ features, this capability is key to a smarter, data-driven operation. And with the latest update, Field Region Reports by Application Rate, new functionalities allow you to do more, track more, and get more robust results out of your data. Let’s take a look at what’s new with Field Region Reports, and how you can take advantage of the latest updates.
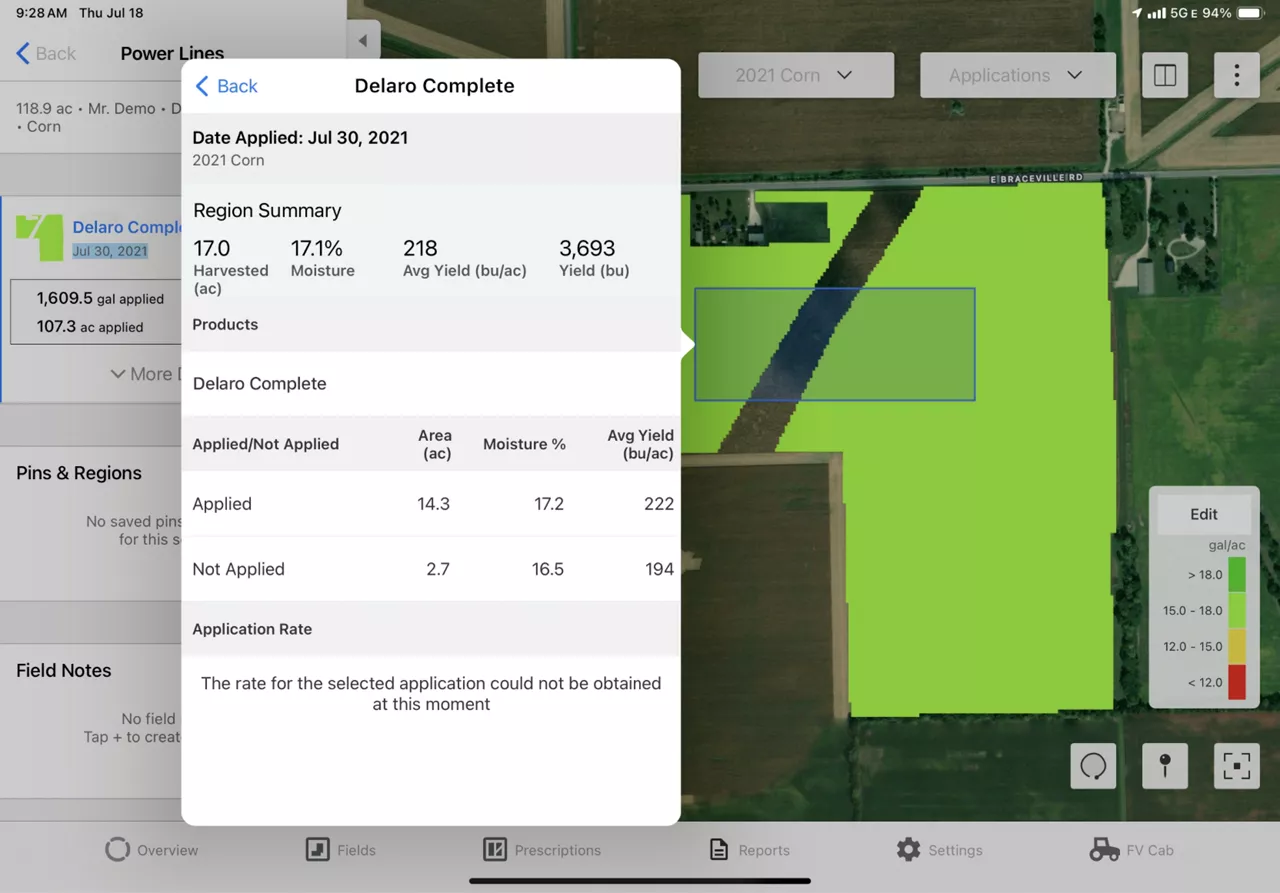
Originally, Field Region Reports allowed a grower to draw a region and see elements like seed product, soil type, elevation and population. From the beginning, this functionality has given growers the ability to turn every acre on their farm into a trial, whether intentionally or in response to changes or events that occur. In October of 2023, we released the enhancement Field Region Reports by Application, which allowed growers to visualize an additional application layer. This gave growers the ability to analyze application layer data and make more informed decisions. With this added functionality, growers were enabled to easily compare and analyze tank application data with untreated checks.
So what’s new this year? With our latest update, Field Region Reports by Application Rate, growers can go a step further in analyzing and reporting application data. Now, not only can they visualize how a particular application impacts a field, but they can also understand the rate at which that application is the most effective in a given field. Instead of just comparing different tank mixes, they can now compare how application rates impact their return on investment.
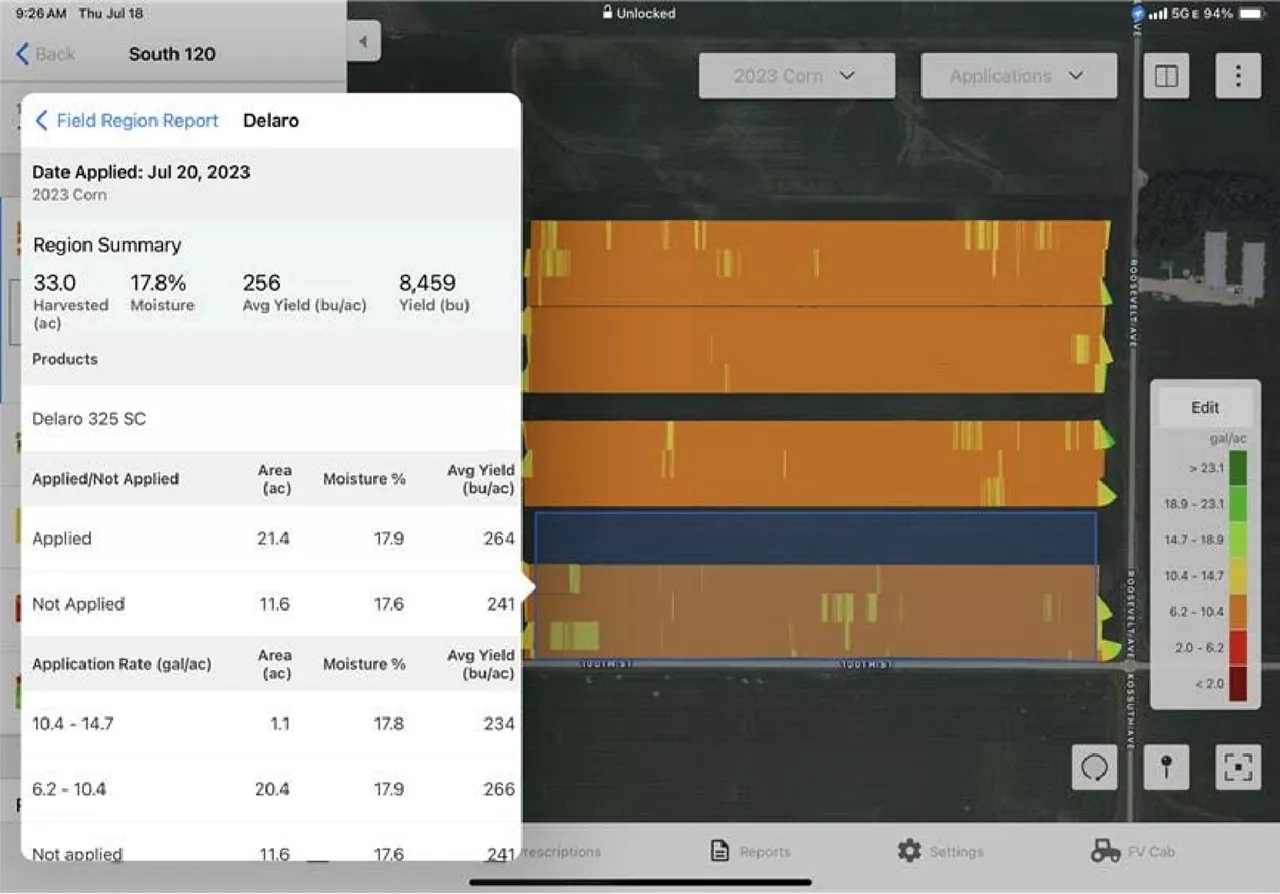
This new capability has exciting implications for all growers to track and visualize applications made on their operation, as Field Region Reports allow customers to learn all season long. For example, let’s imagine a grower is running a fungicide trial on their farm this year. Before, Field Region Reports would allow the grower to understand the yield difference between where the fungicide was applied versus where it wasn’t. But with the latest update, they can take this information to the next level to understand how different rates of a fungicide, insecticide, fertility, or other in-season applications impact ROI.
Field Region Reports tell a comprehensive story to help growers maximize productivity on every acre of their farm. This powerful tool can help growers understand how management practices impact yield across their whole operation, instead of just the results of one trial on one field during one season. These reports allow the grower to see the whole picture of their operation, from planting to harvest. Instead of just creating a region at the end of the season to try and determine why yield might be different, growers can keep track of every detail along the way.
This might look like drawing regions throughout the year to get a pulse check on certain trials and applications, and then using that data to back up yield results at the end of the year. Or maybe a grower notices a hotspot in their field in August, and decides to investigate. They can create a Field Region Report to learn more about what is happening in that part of the field, and can save that region to allow them to check back in throughout the season, or share with their trusted advisor. Now, they know how to document those acres, and can follow up at harvest to understand the implication of the treated versus untreated acres on their operation.
These updates to Field Region Reports are just one way we’re ensuring that FieldView can be an essential tool for decision-making. The more data we can give growers to make informed decisions or start conversations with their advisors, the more successful they can be. And when it comes to what you need to have a successful operation, no one knows better than you.
Our customers’ voices have guided the evolution of this feature from start to finish. The result? A tool made specifically with you in mind.
We’re dedicated to listening to your feedback and continuing to deliver solutions to improve functionality and help you make more informed, productive decisions all year long.

The FieldView Drive 2.0 can send seed scripts without a thumb drive, has built-in GPS, offers faster data syncing and compatibility with a wider range of equipment.

FieldView's platform partner, Drone Deploy, gives you cutting-edge software gives you a deeper understanding of your fields, and can help you make more efficient, informed decisions—all from the edge of your field.
FieldView makes it easy to spot inconsistencies in the field; it’s just a matter of telling the difference between dark green and light green.