How to Use Field Region Reports on FieldView.com, the FieldView App and FieldView Cab App
Overview
Field Region Reports functionality exists within the FieldView™ app, FieldView™ Cab app and fieldview.com. Field Region Report is a powerful tool to provide better understanding of the variability in your fields. Identify yield limiting factors by analyzing seed performance or management practices in specific regions of your fields.
FieldView Field Region Report Details
FRR requires a FieldView Plus subscription & an internet connection
Regions drawn in one area of the platform flow through to the other areas.
Field Region Report functionality exists within the FieldView™ app, FieldView™ Cab app & fieldview.com
Field Region Report by Planter, Sprayer, or Harvester Pass is only available in the FieldView Cab app.
Field Region Report can be created from any Map Layer in FieldView™.
How to Use The Field Region Report on fieldview.com
1. Log in to your FieldView account on www.fieldview.com and confirm you are on the Fields tab and select a field.
2. Tap on the Region button.
3. Select the type of Region - Polygon, Pivot, Rectangle.
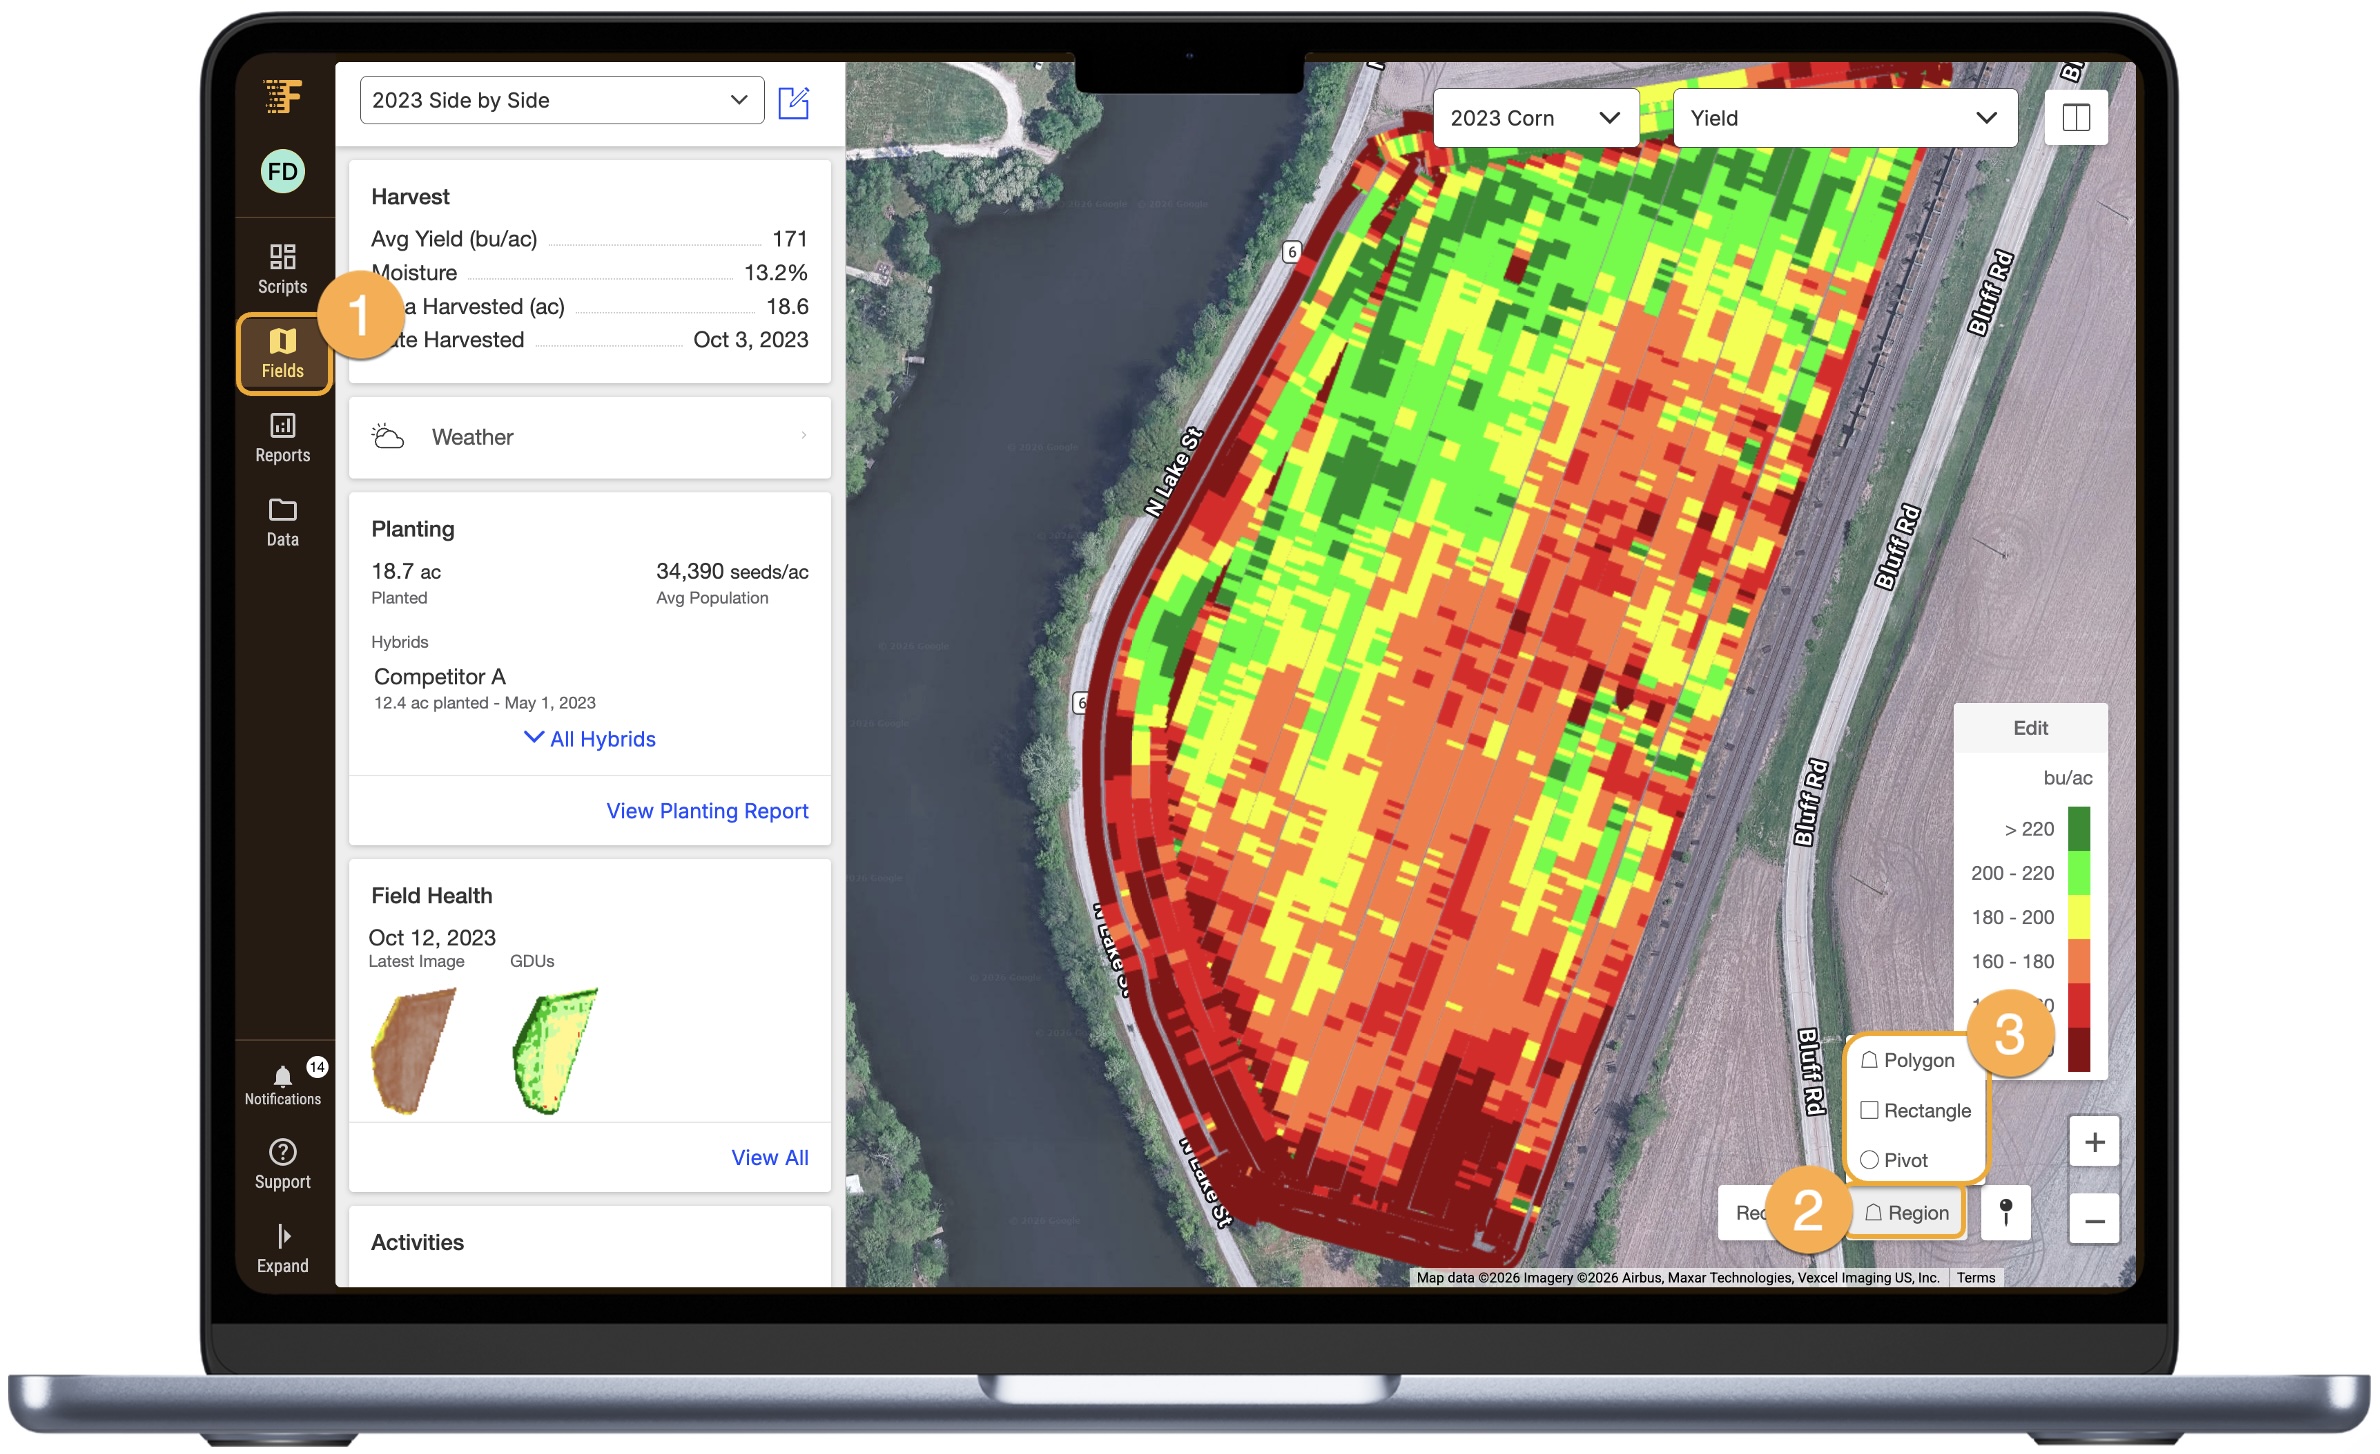
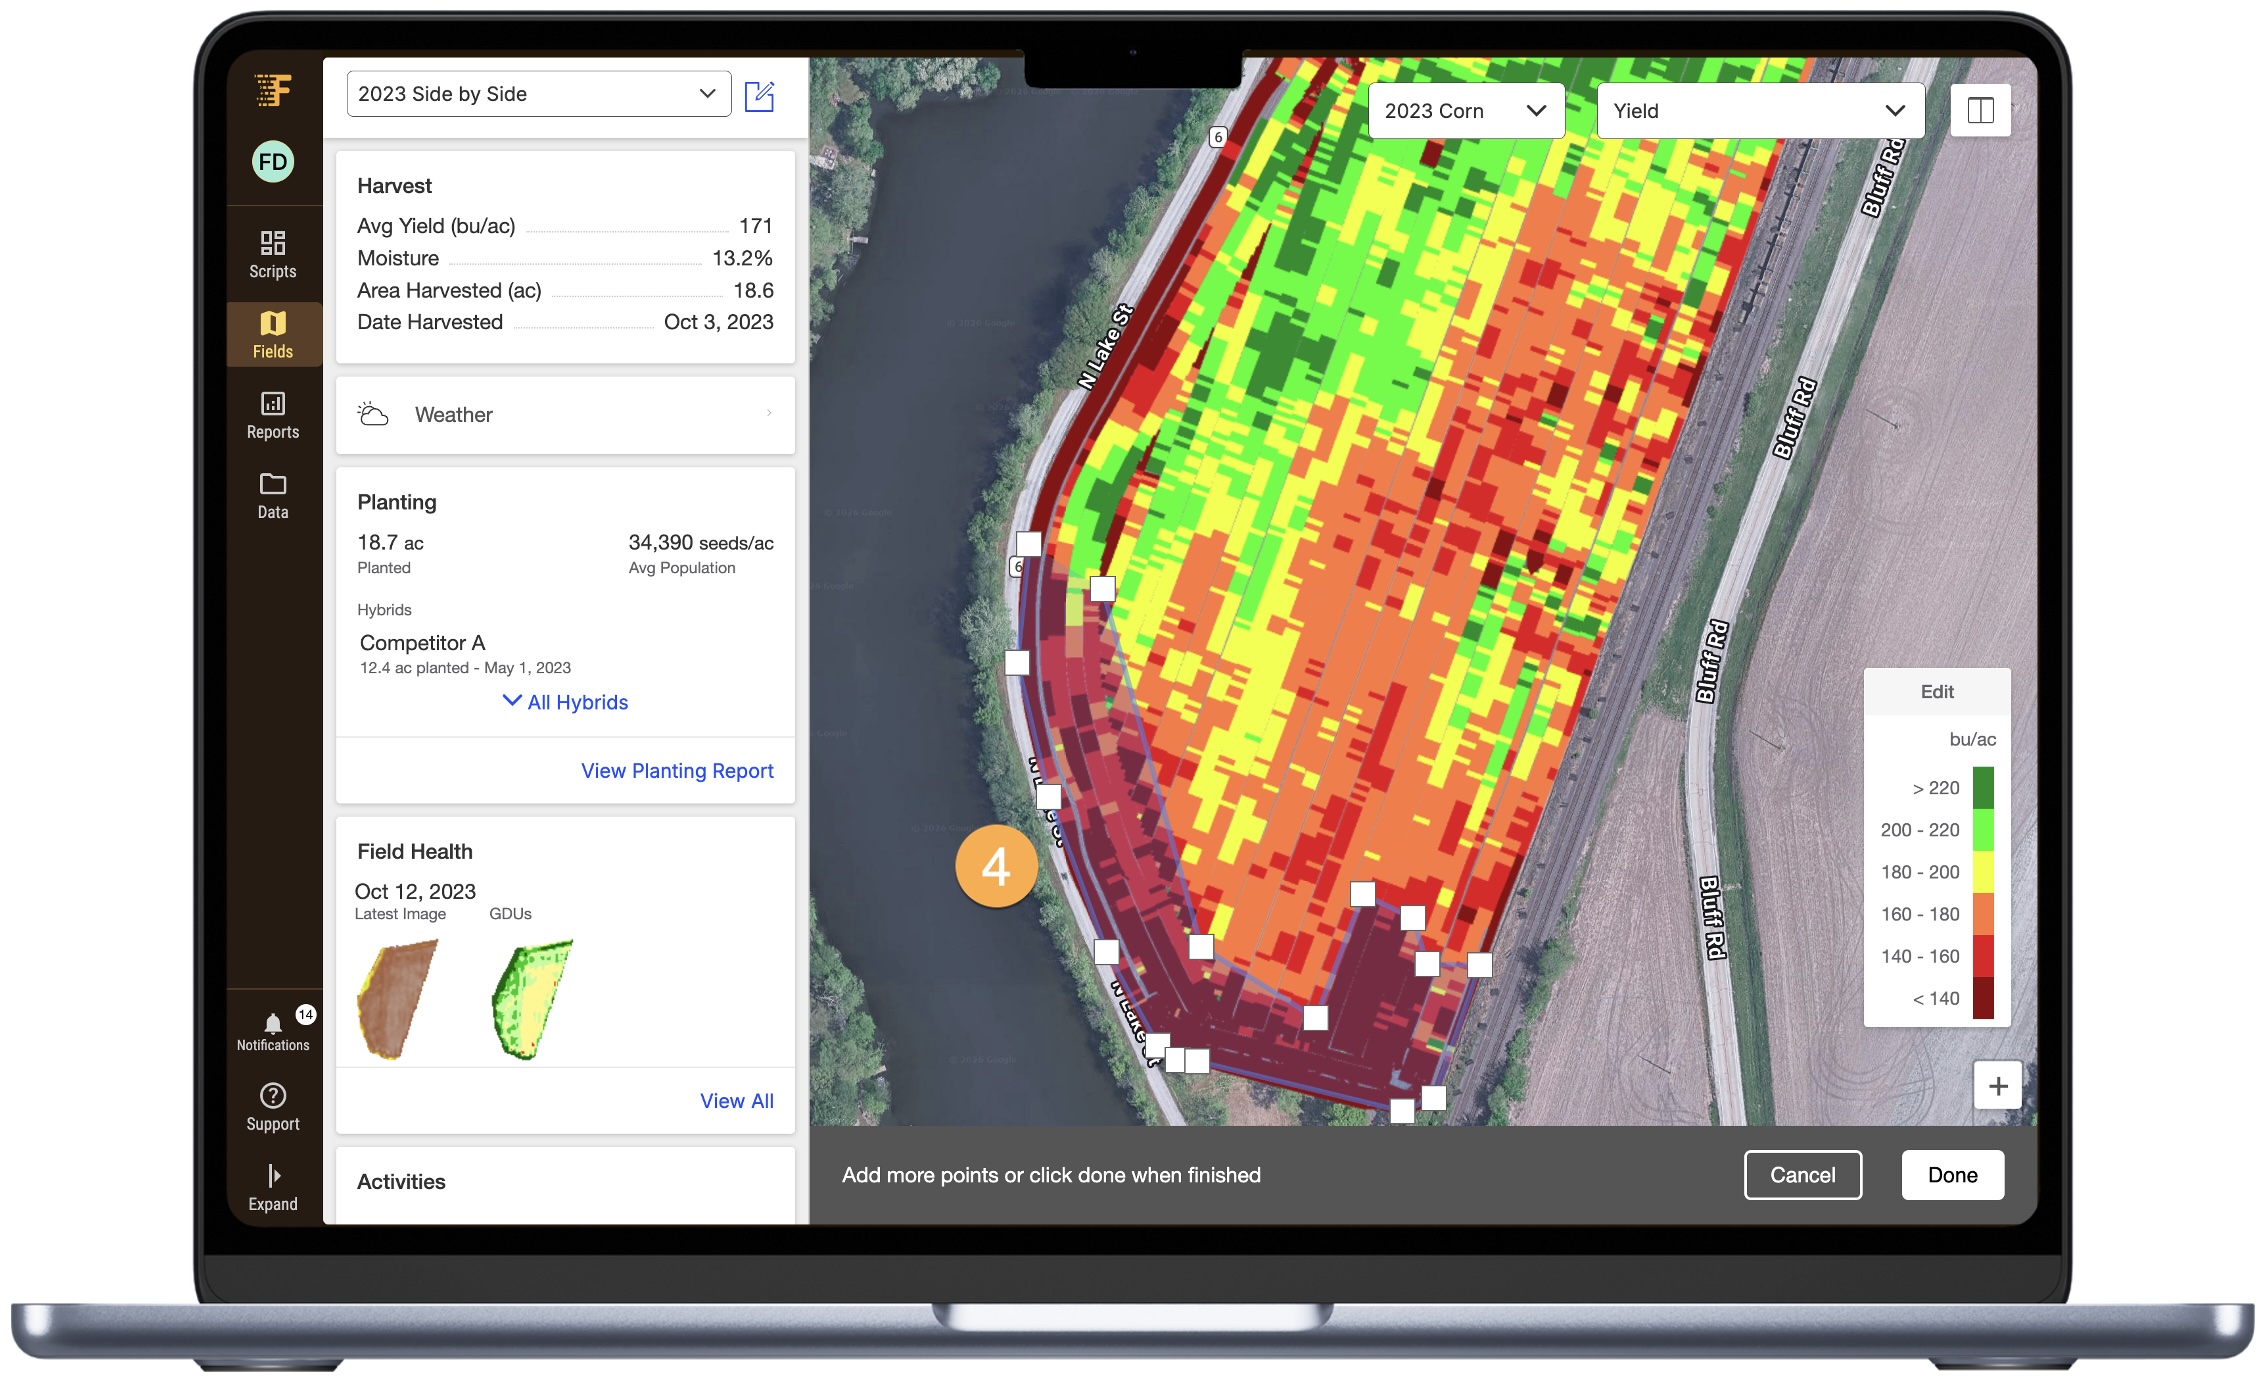
4. Tap on the map to add points for your shape. Tap Done once the perimeter of your shape is created. Pivot - Place the cross hair in the center and drag out to create the correct the correct size.
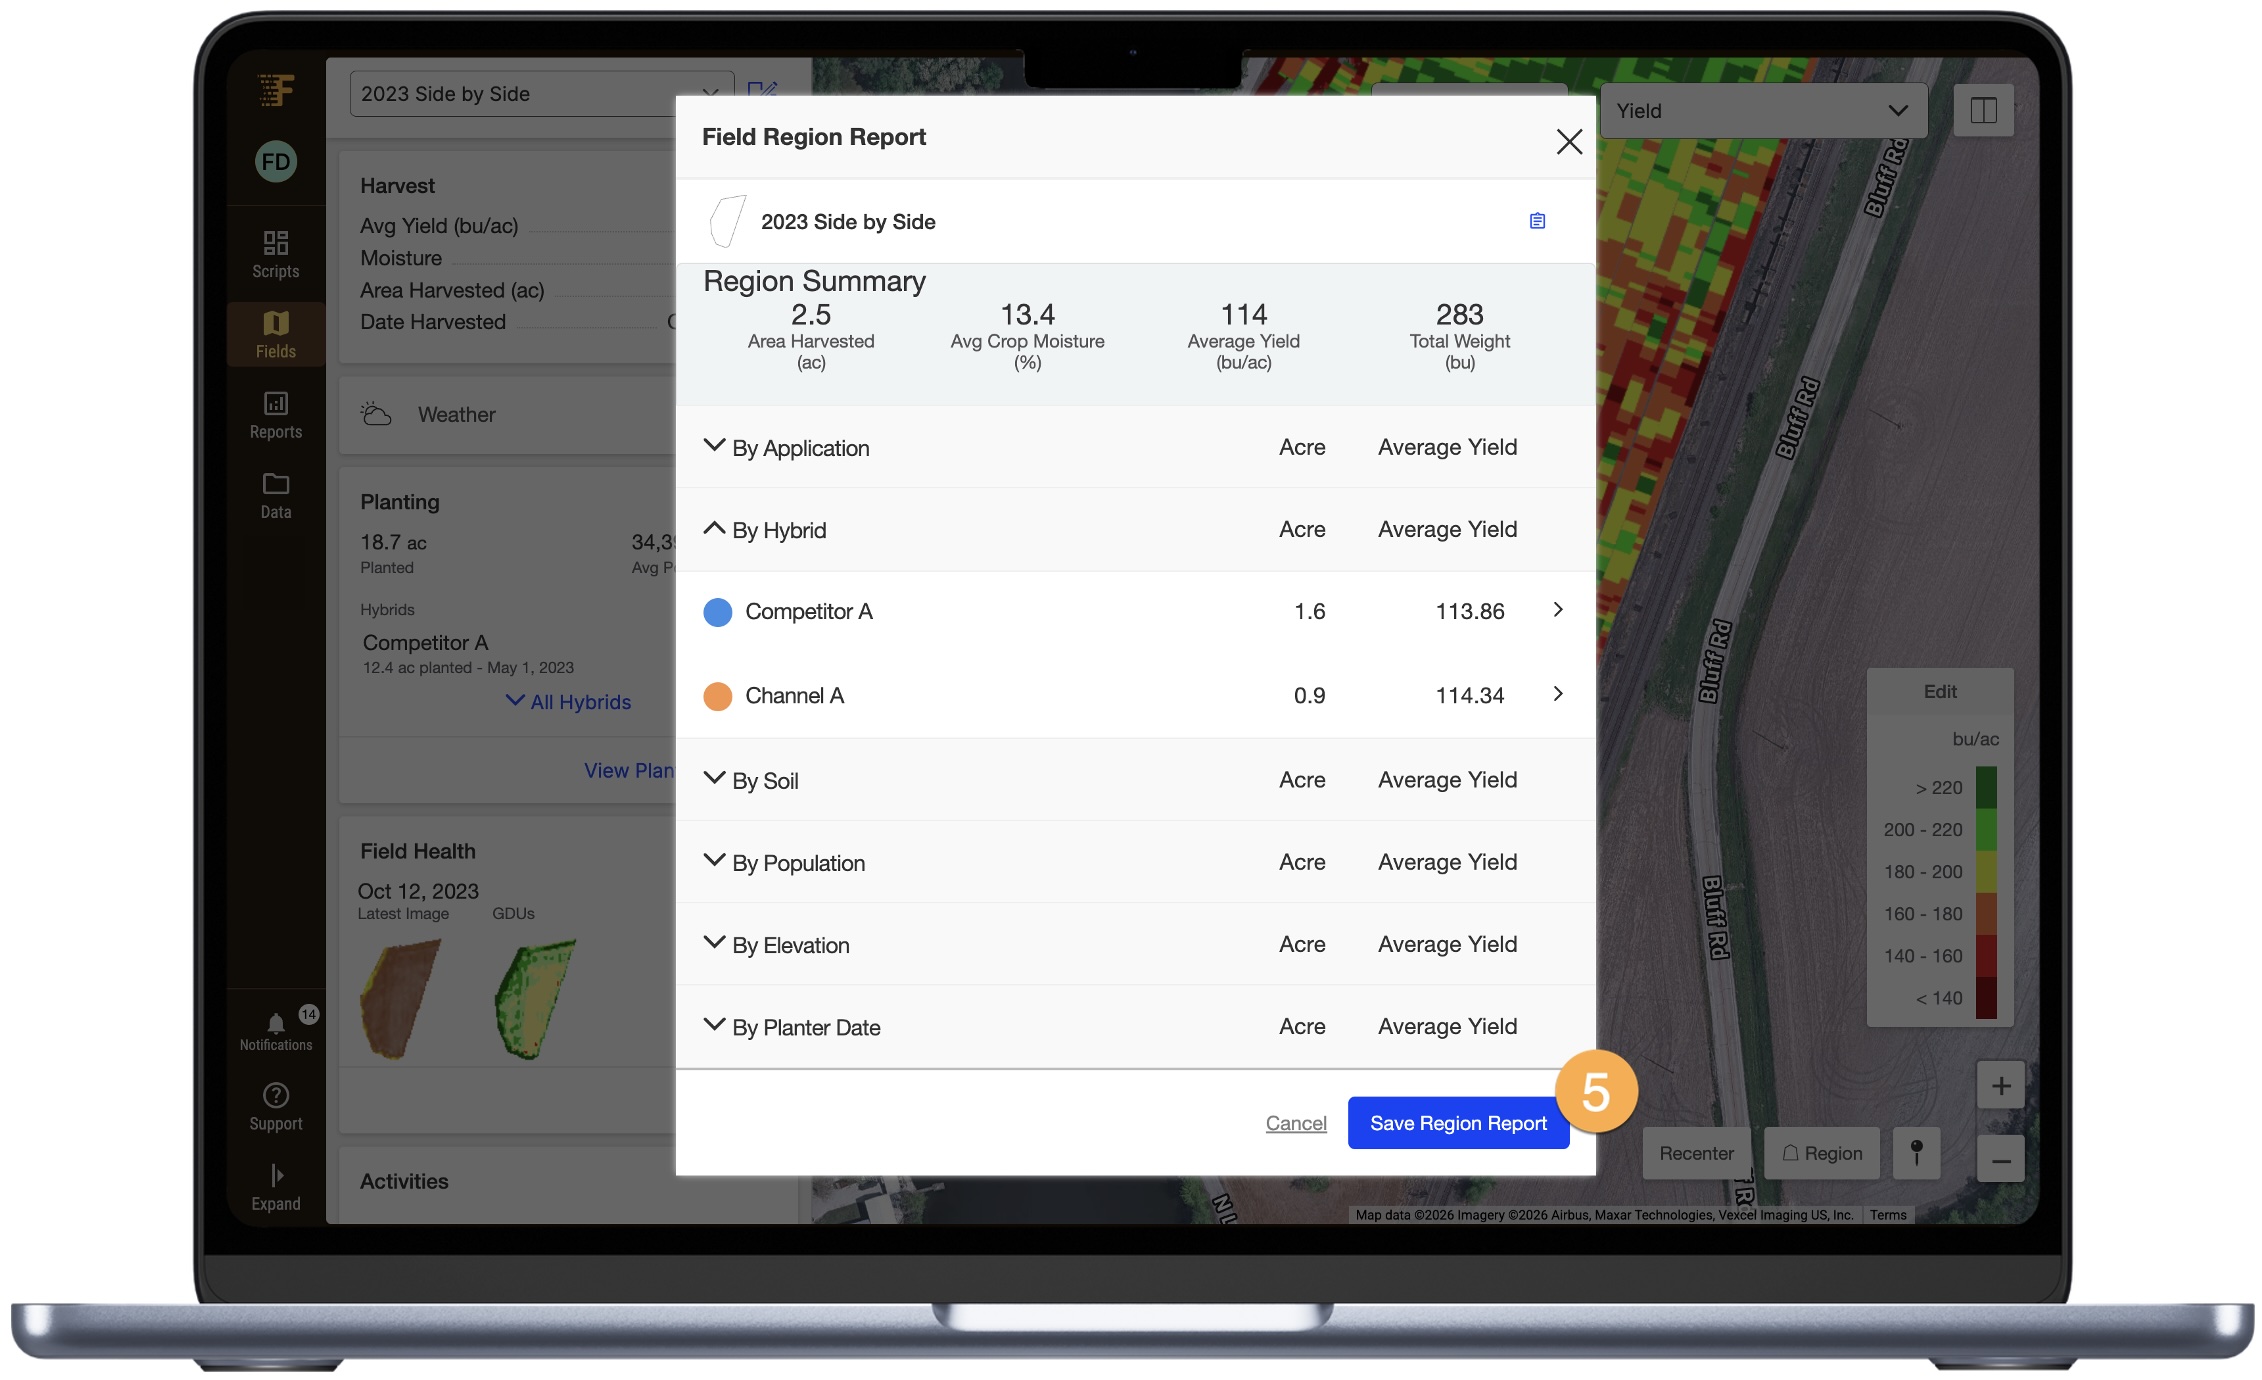
5. The Field Region Report will be created. Each section can be expanded or collapsed using the arrows on the left. Tap Save Region.
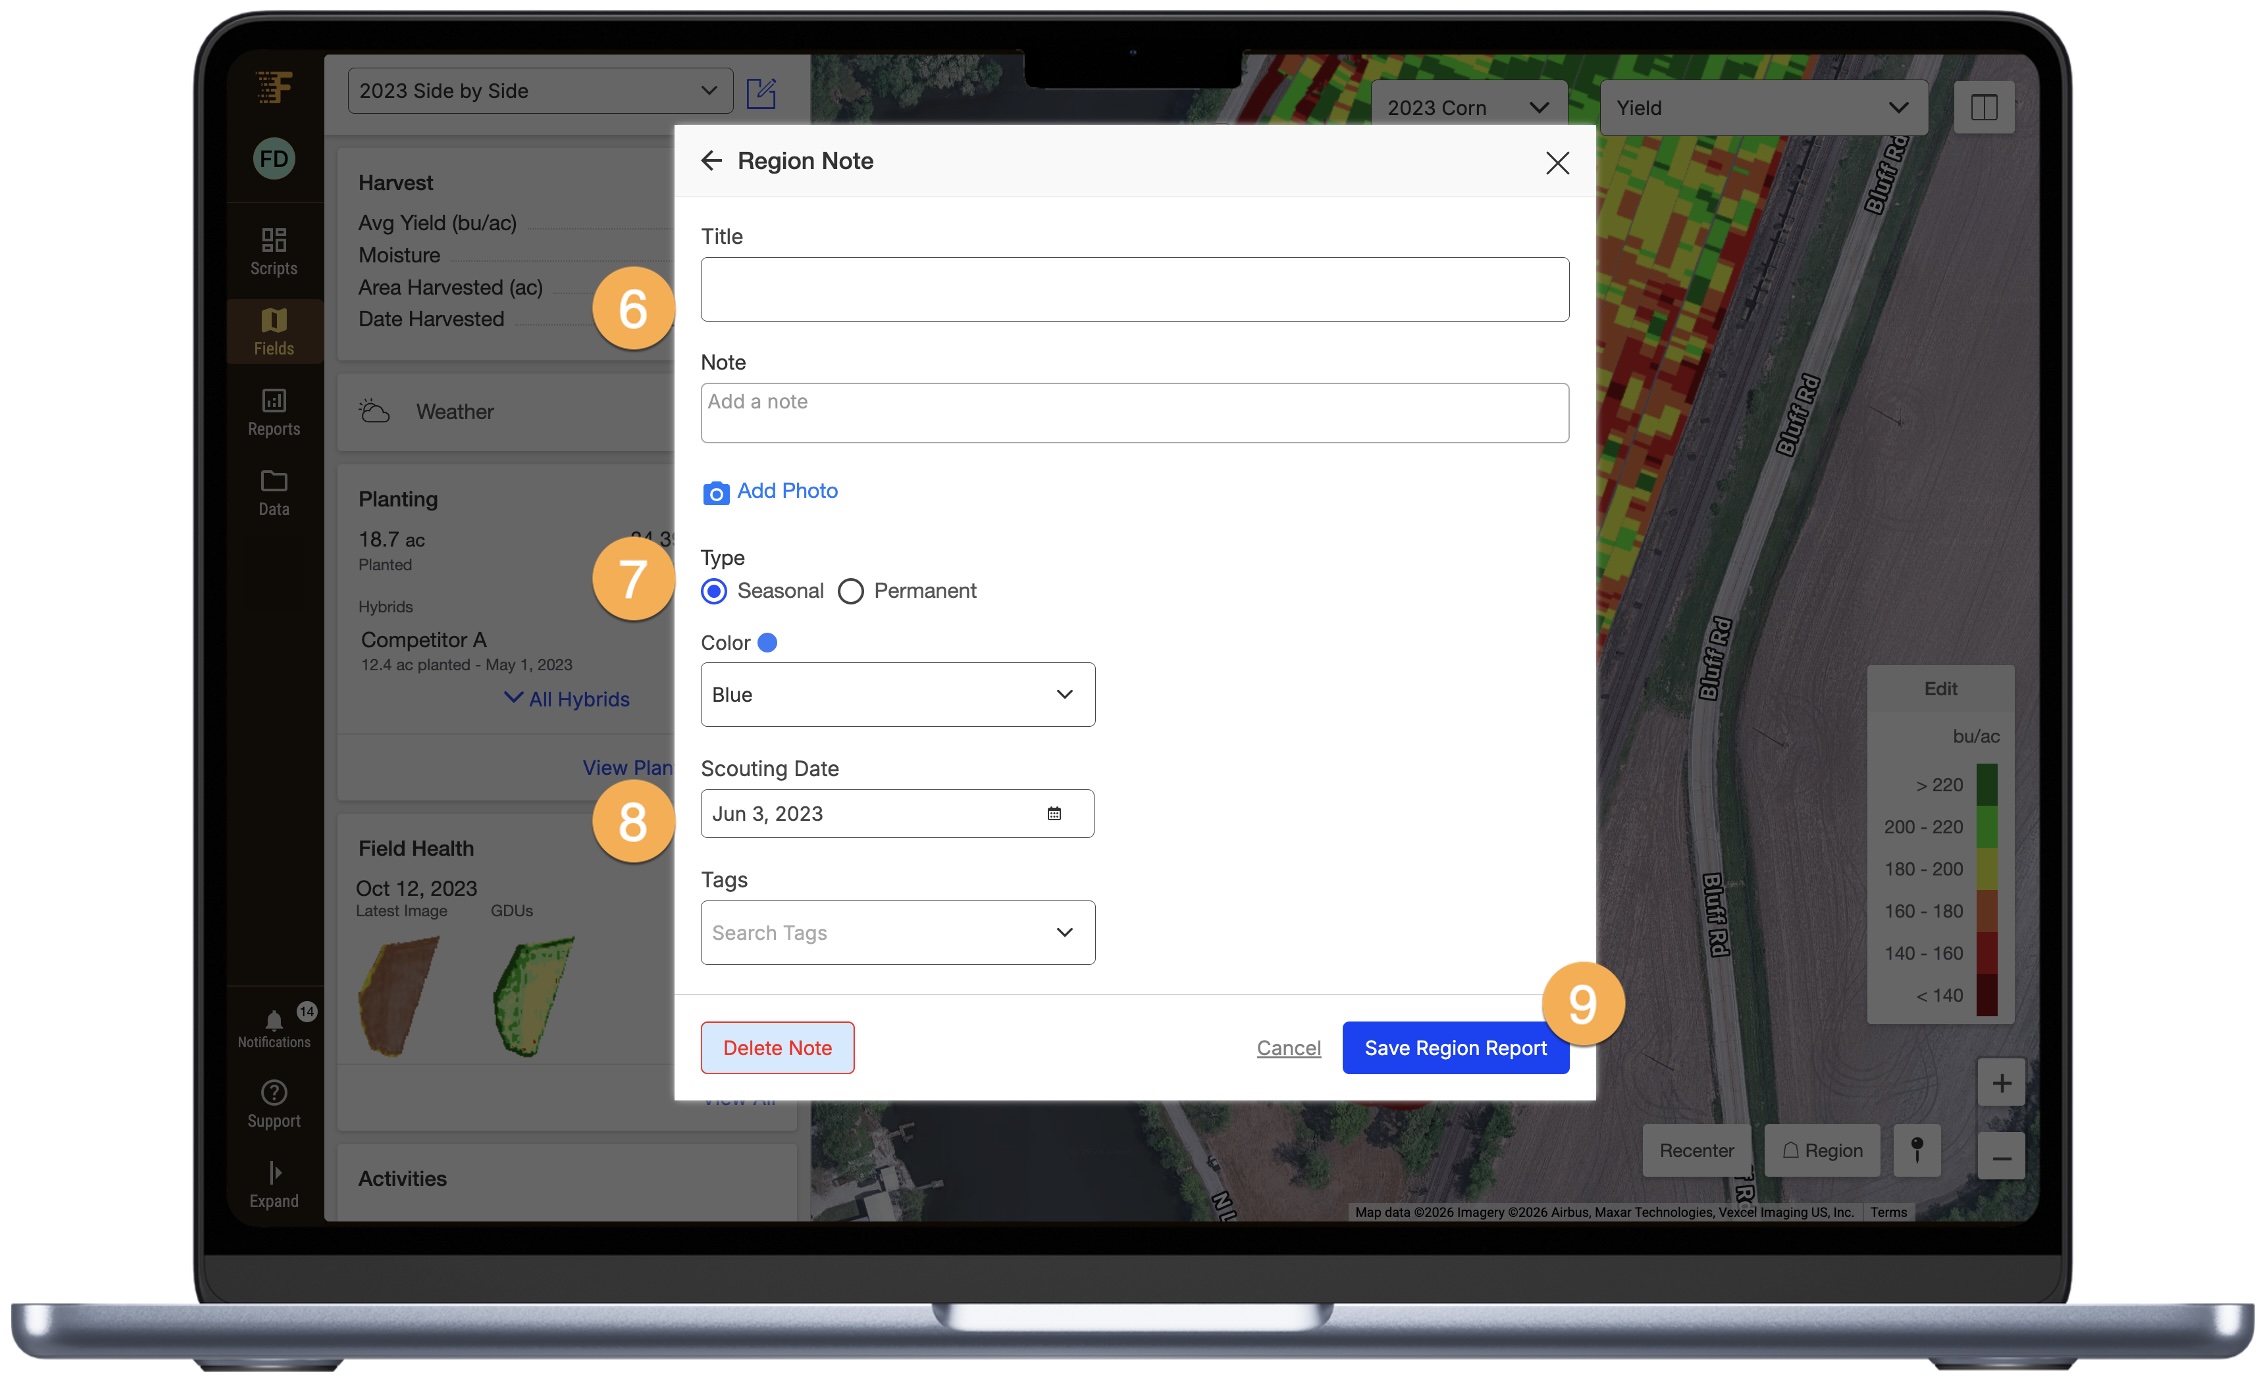
6. Enter a title, notes and add a photo.
7. Mark as seasonal or permanent and set the color.
8. Adjust the date of the Field Region Report
9. Tap Save Note.
How to Use The Field Region Report in the FieldView™ App
*Available for Android and iOS devices in FieldView™ app
1. In the FieldView app, navigate to the Fields page by selecting Fields at the bottom of the screen.
2. Select the Field on the left.
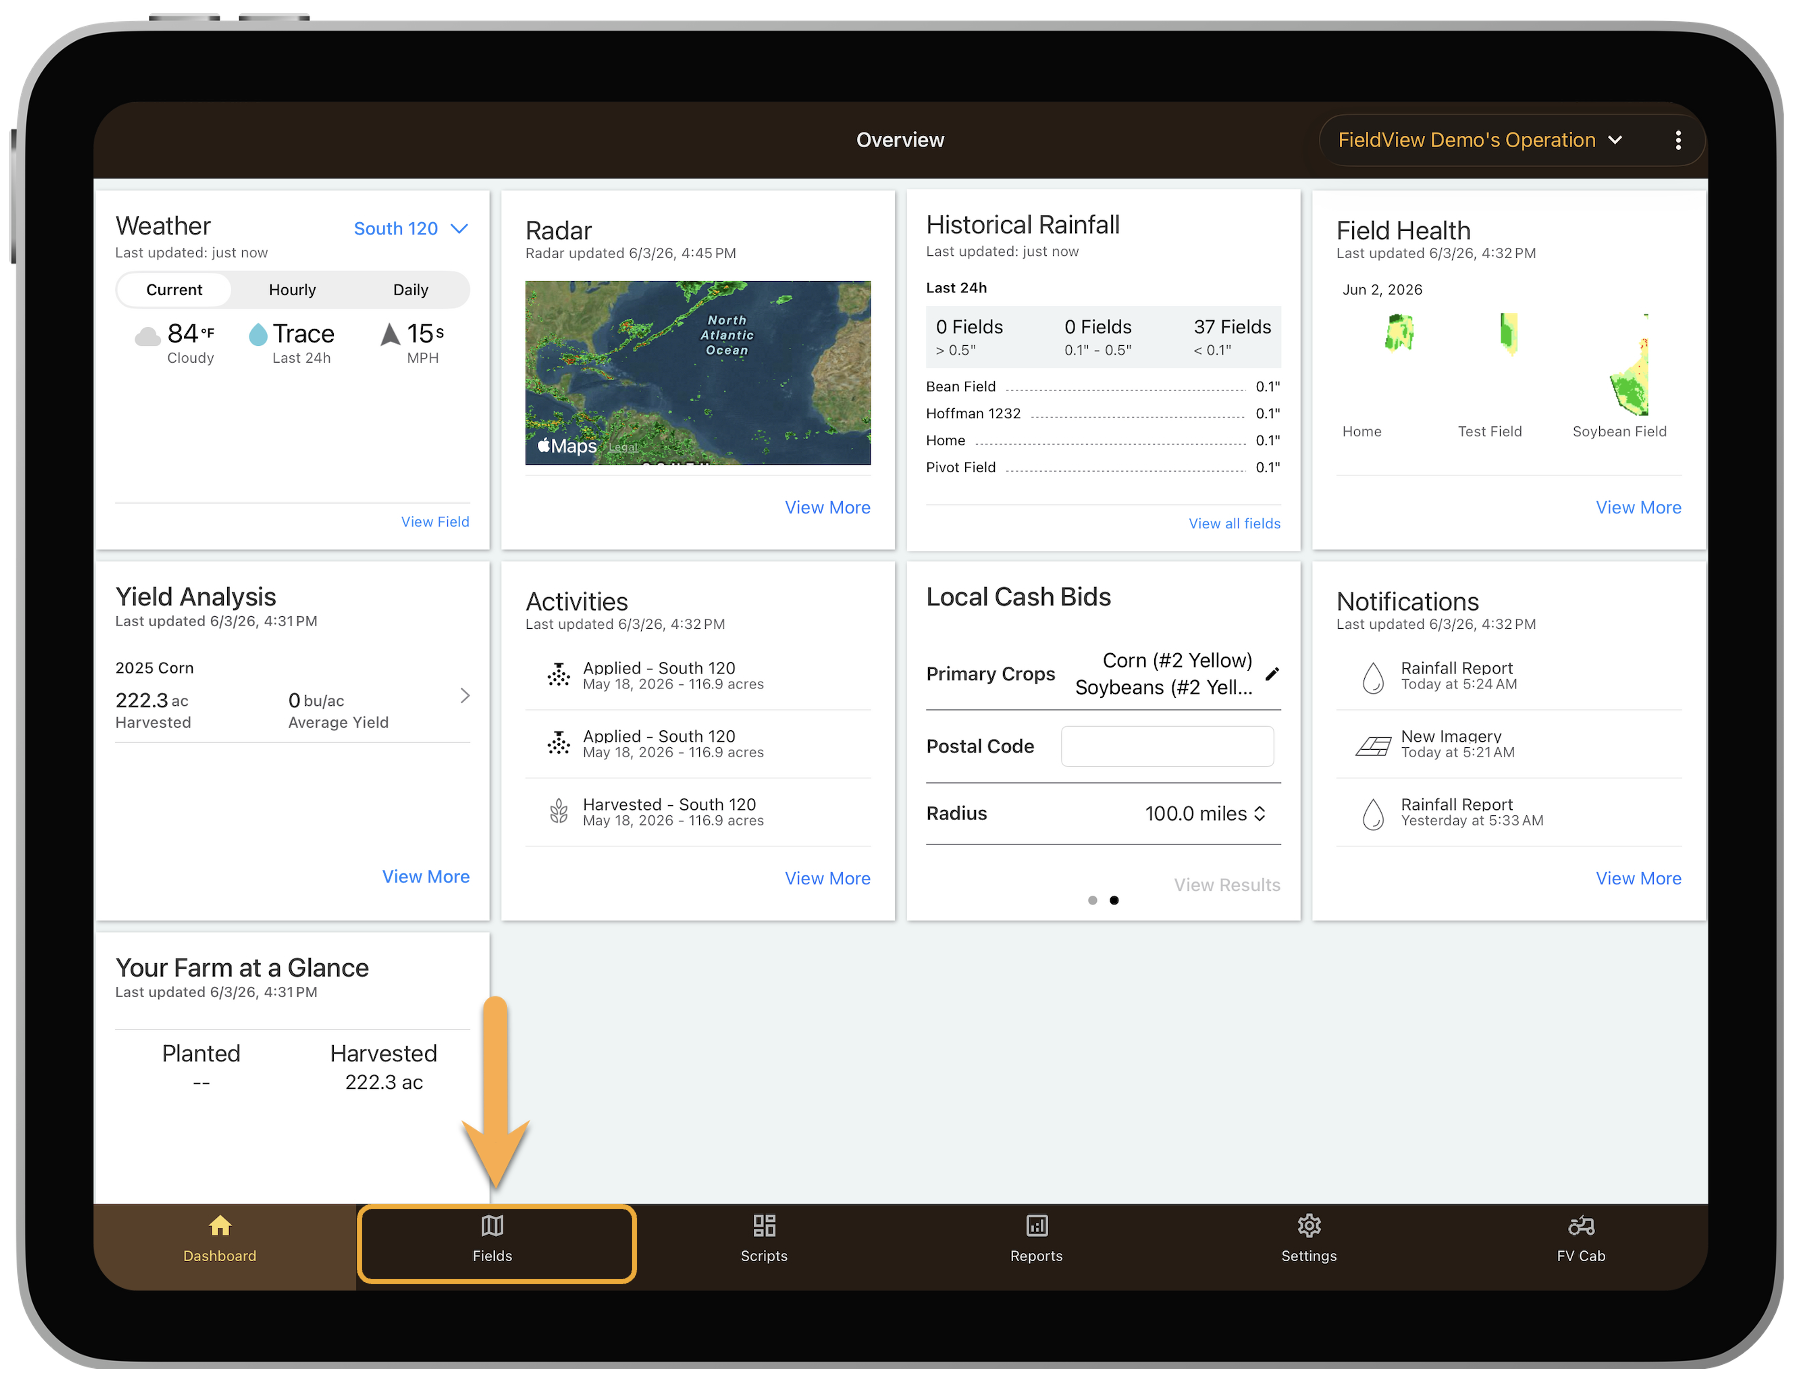
3. Tap Field Region Report button.
4. Select Freeform, Polygon, Pivot, or Rectangle.
5. Draw region with finger.
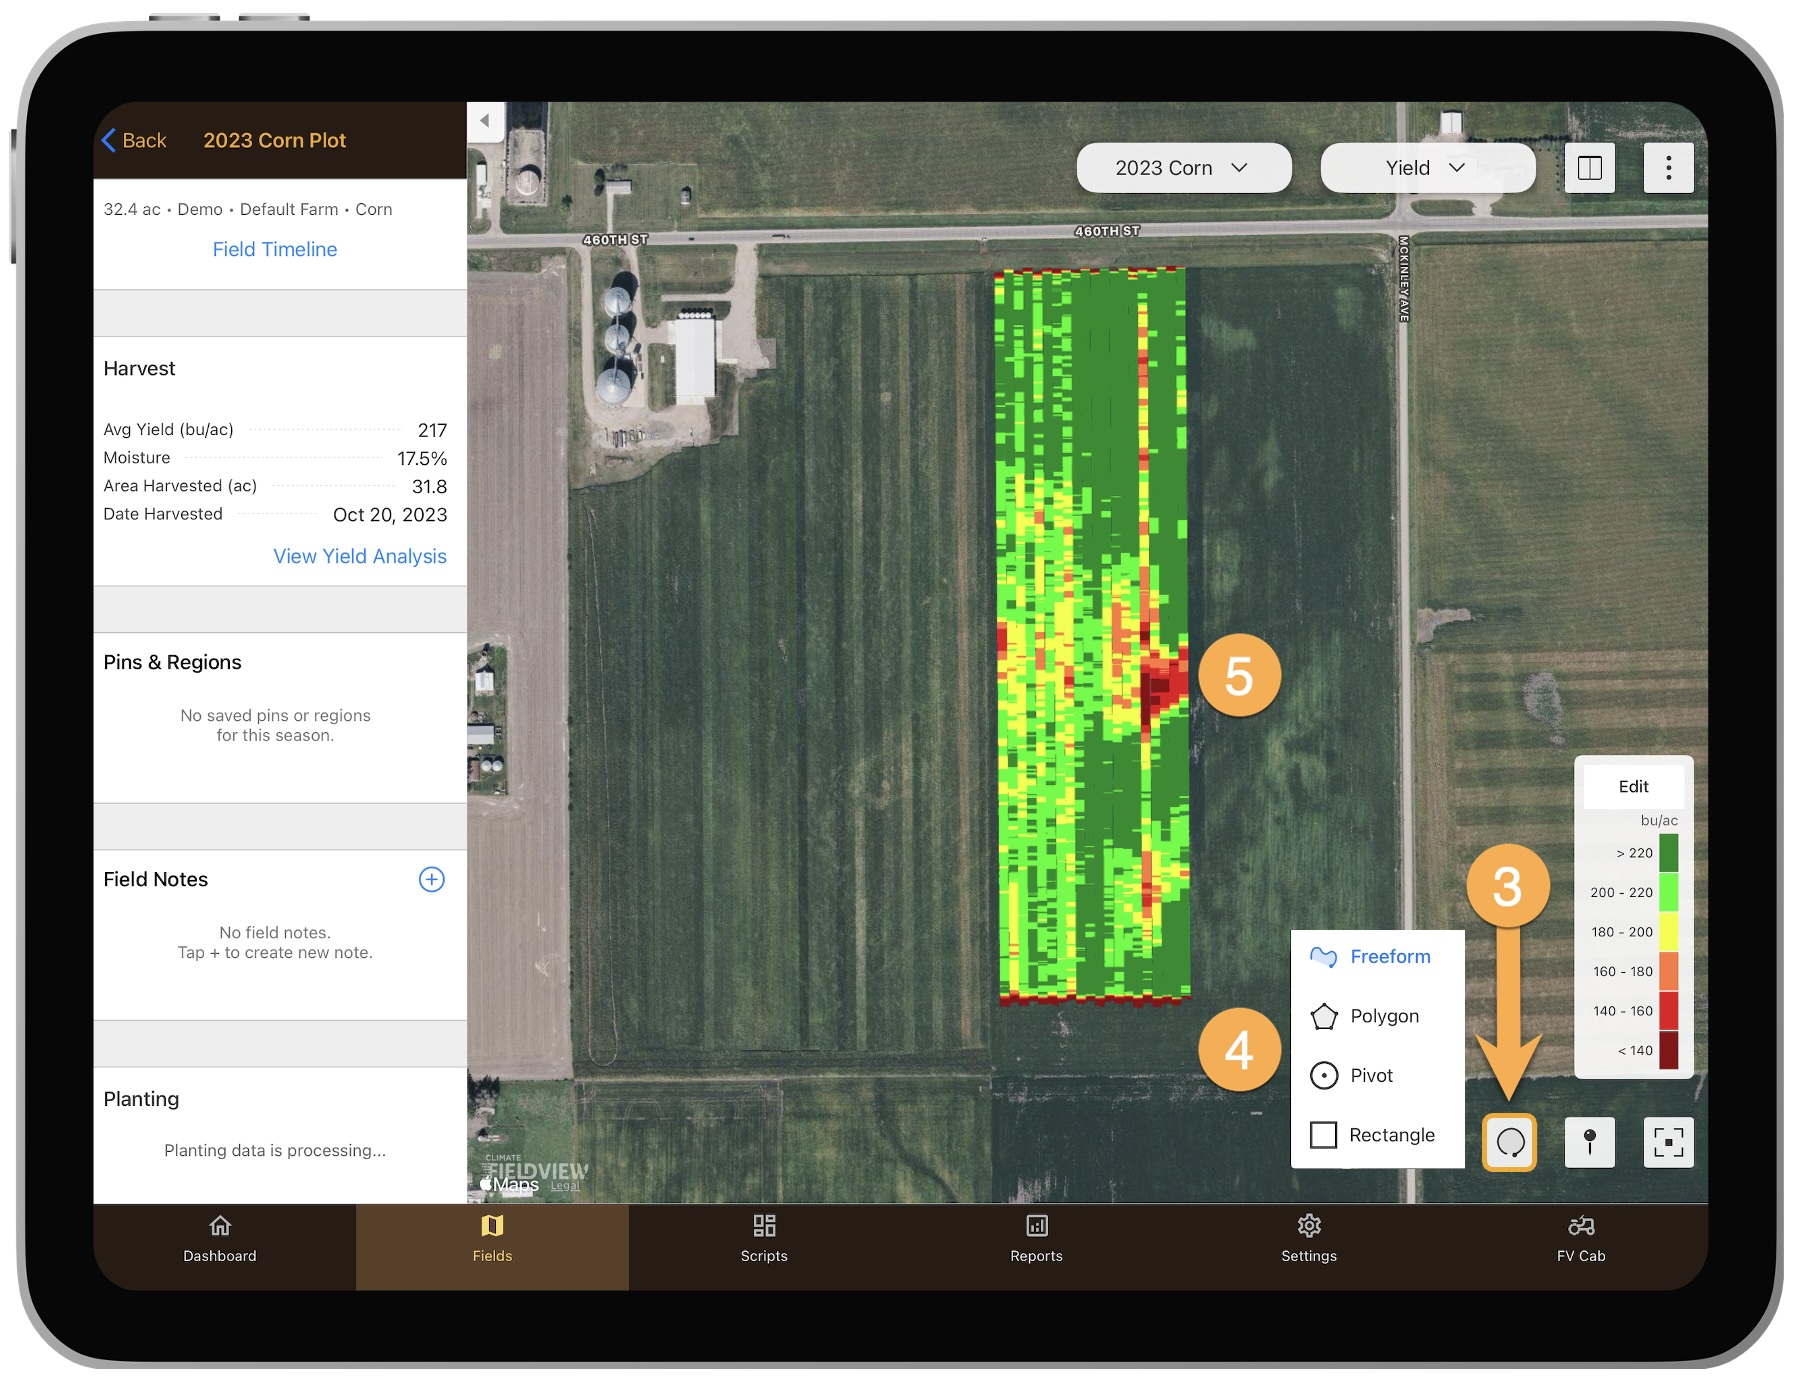
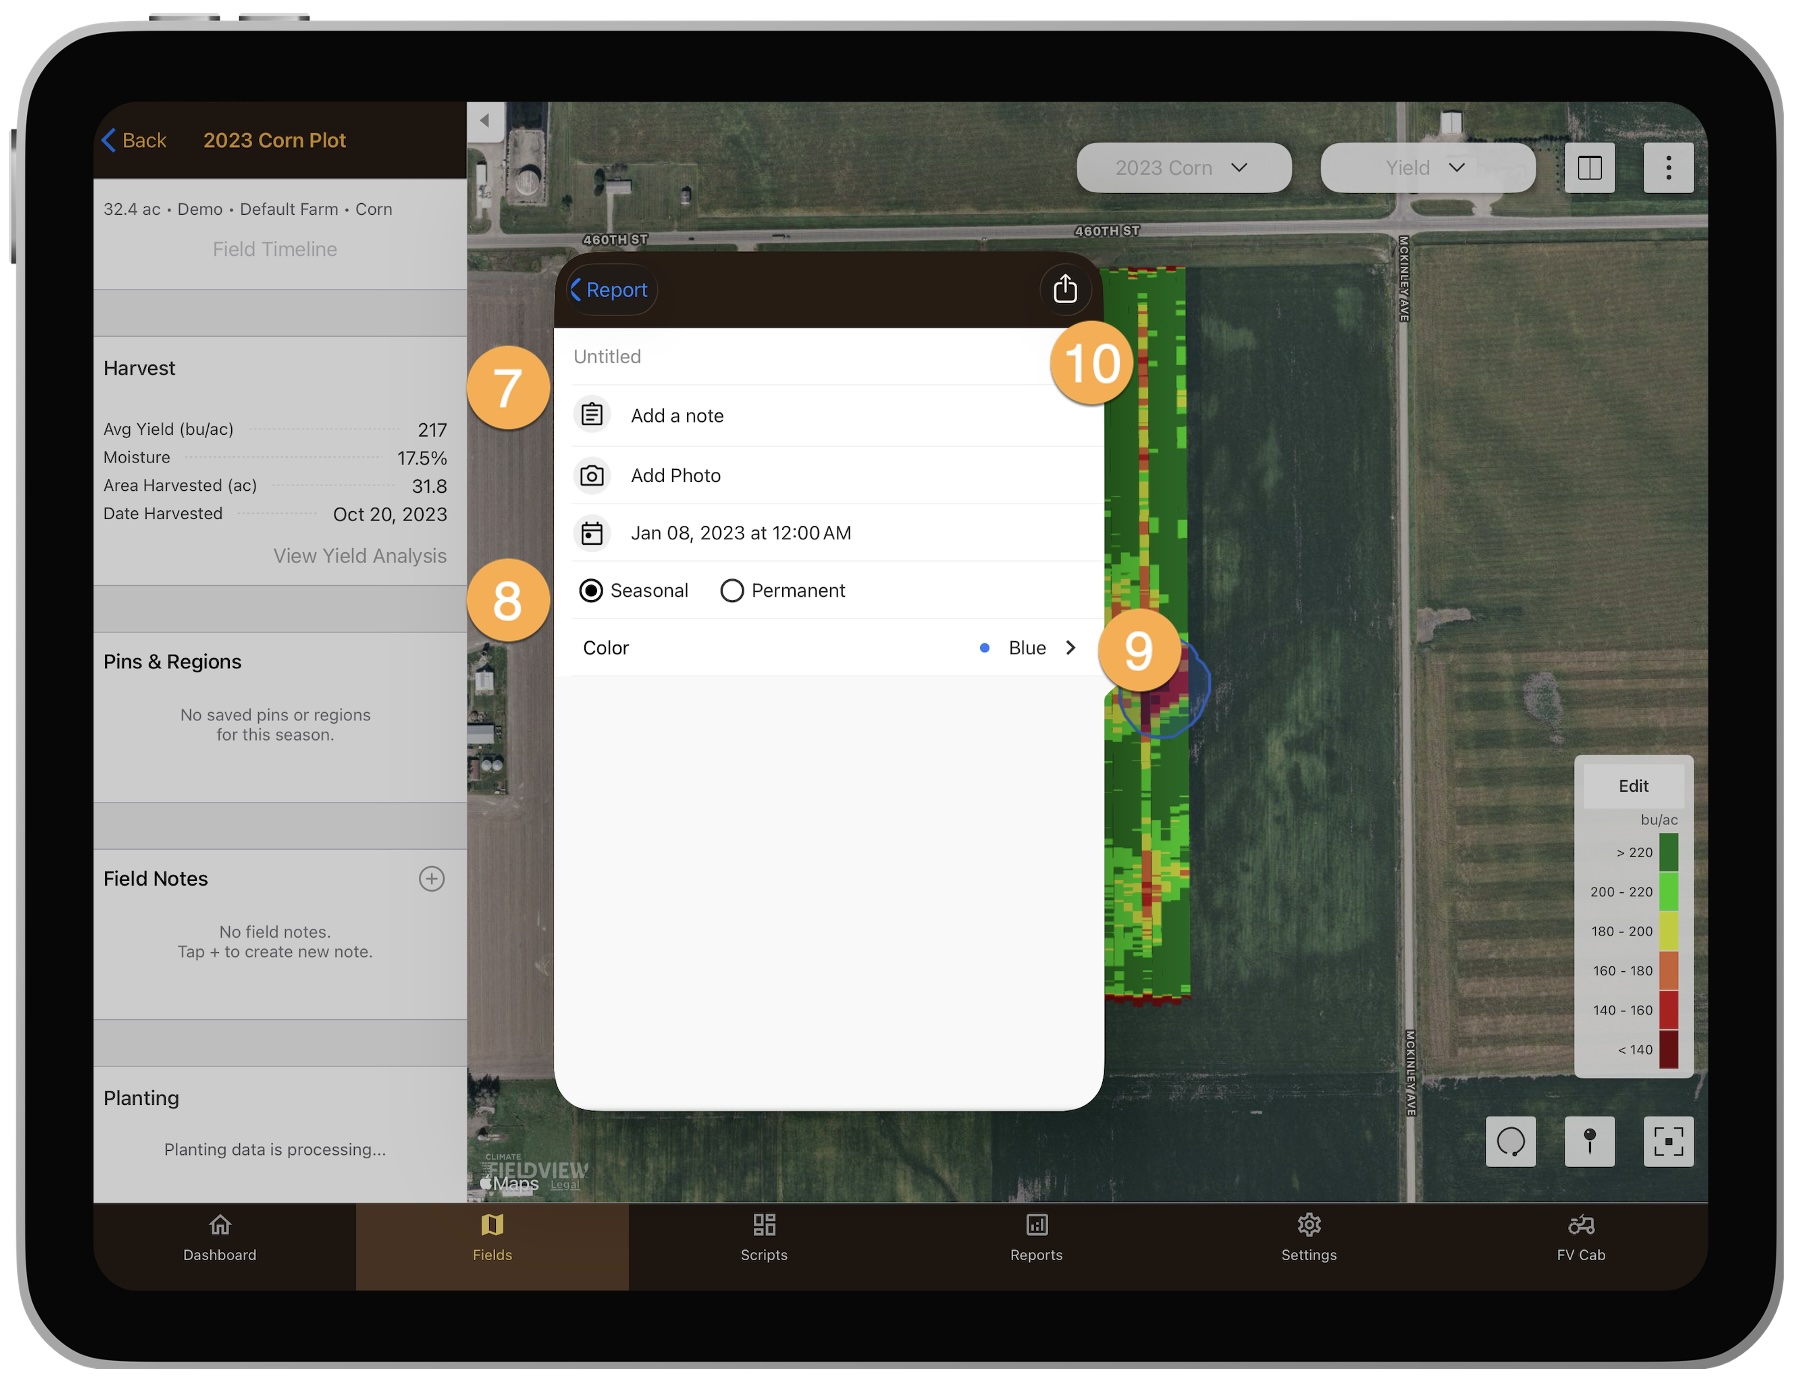
6. Tap Add a note.
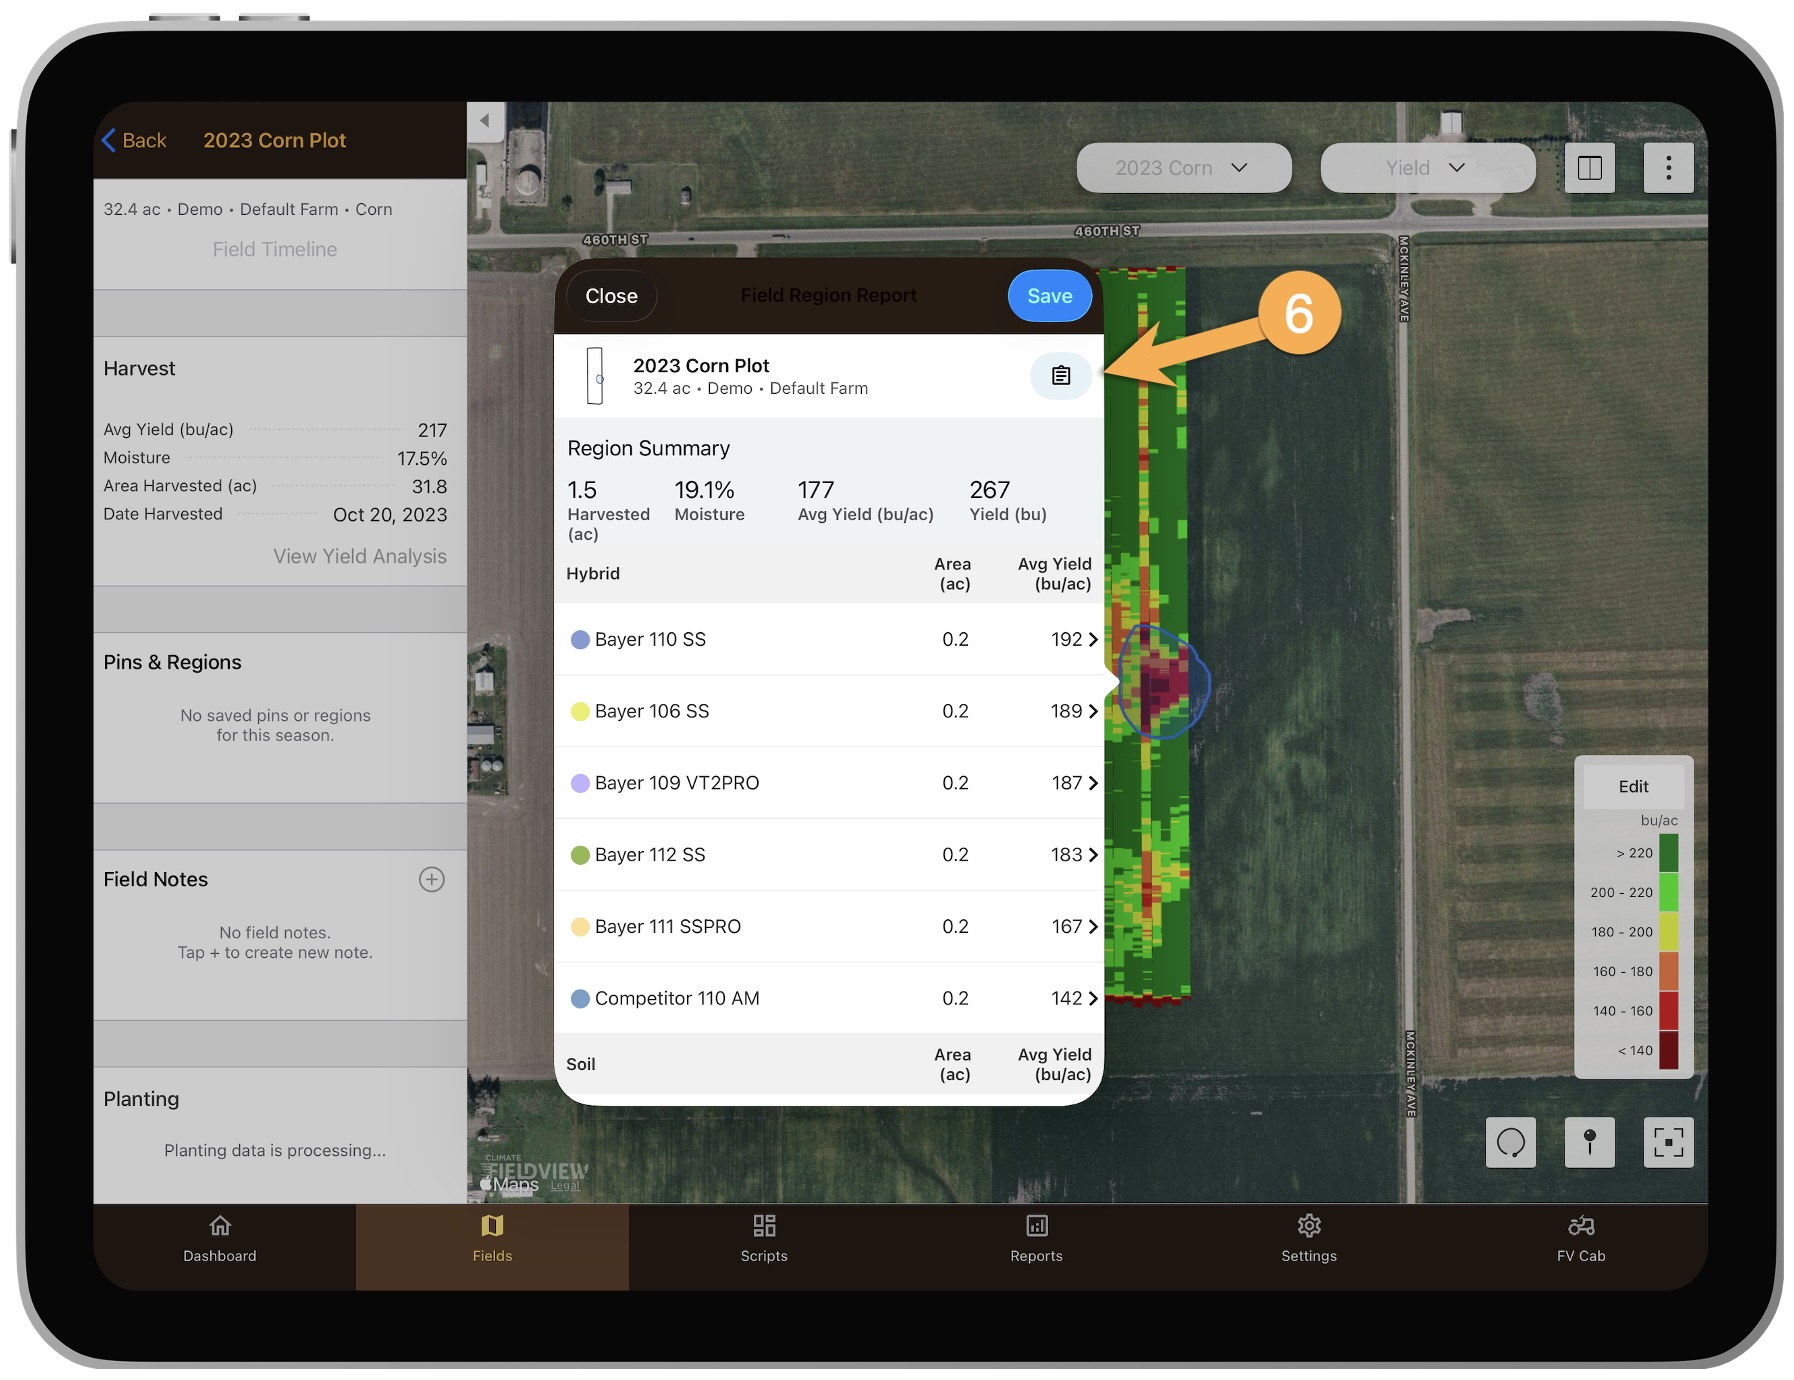
7. Add title, photo, and notes.
8. Identify region as seasonal or permanent.
9. Select a color for the region outline.
10. Tap Report to go back, then Save.
How to Use The Field Region Report in FieldView™ Cab App

*Available in the iOS FieldView™ Cab app
1. From the Map page in FieldView Cab app, select any map layer with passes - planter, sprayer, yield, etc.
2. Select the More button, then tap Create Field Region.
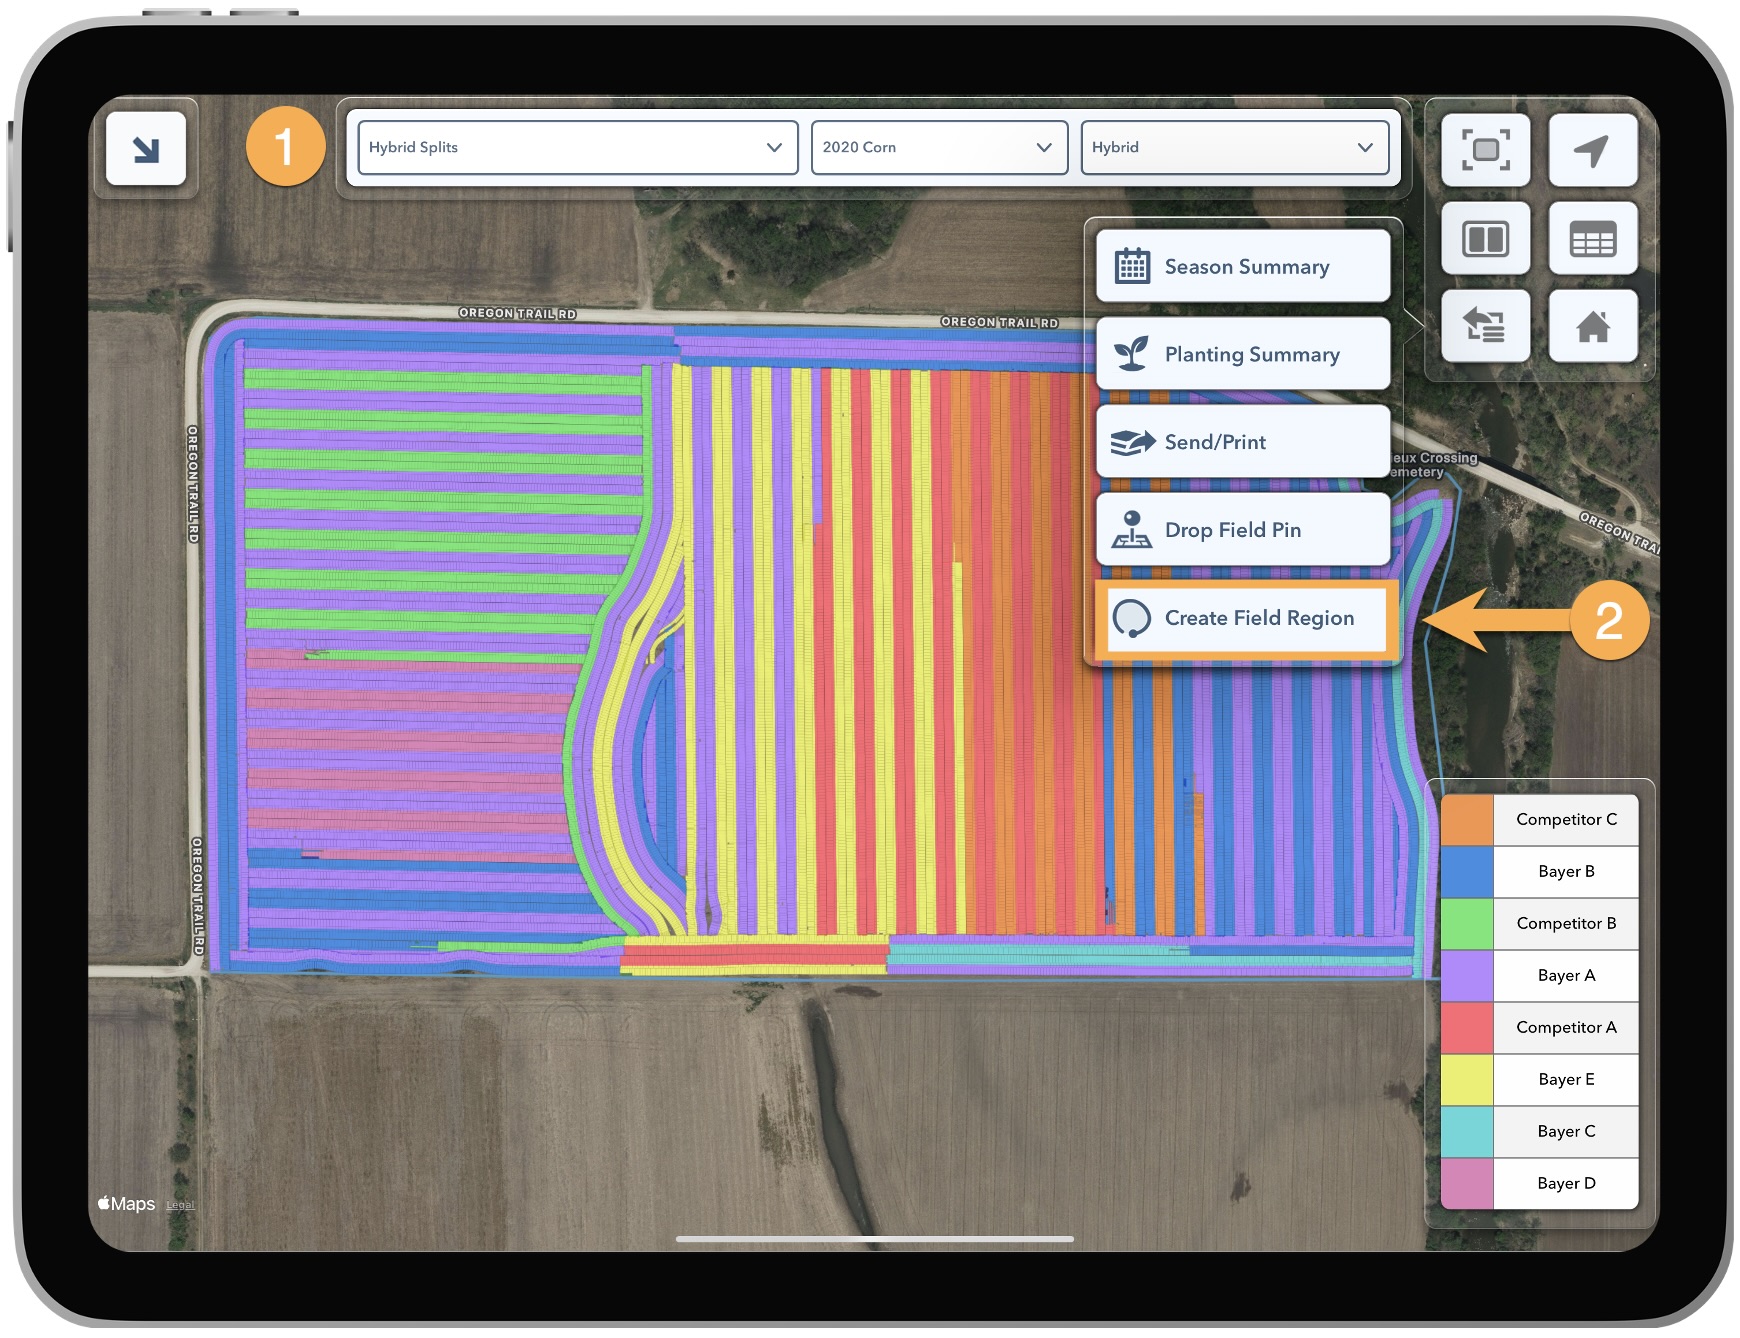
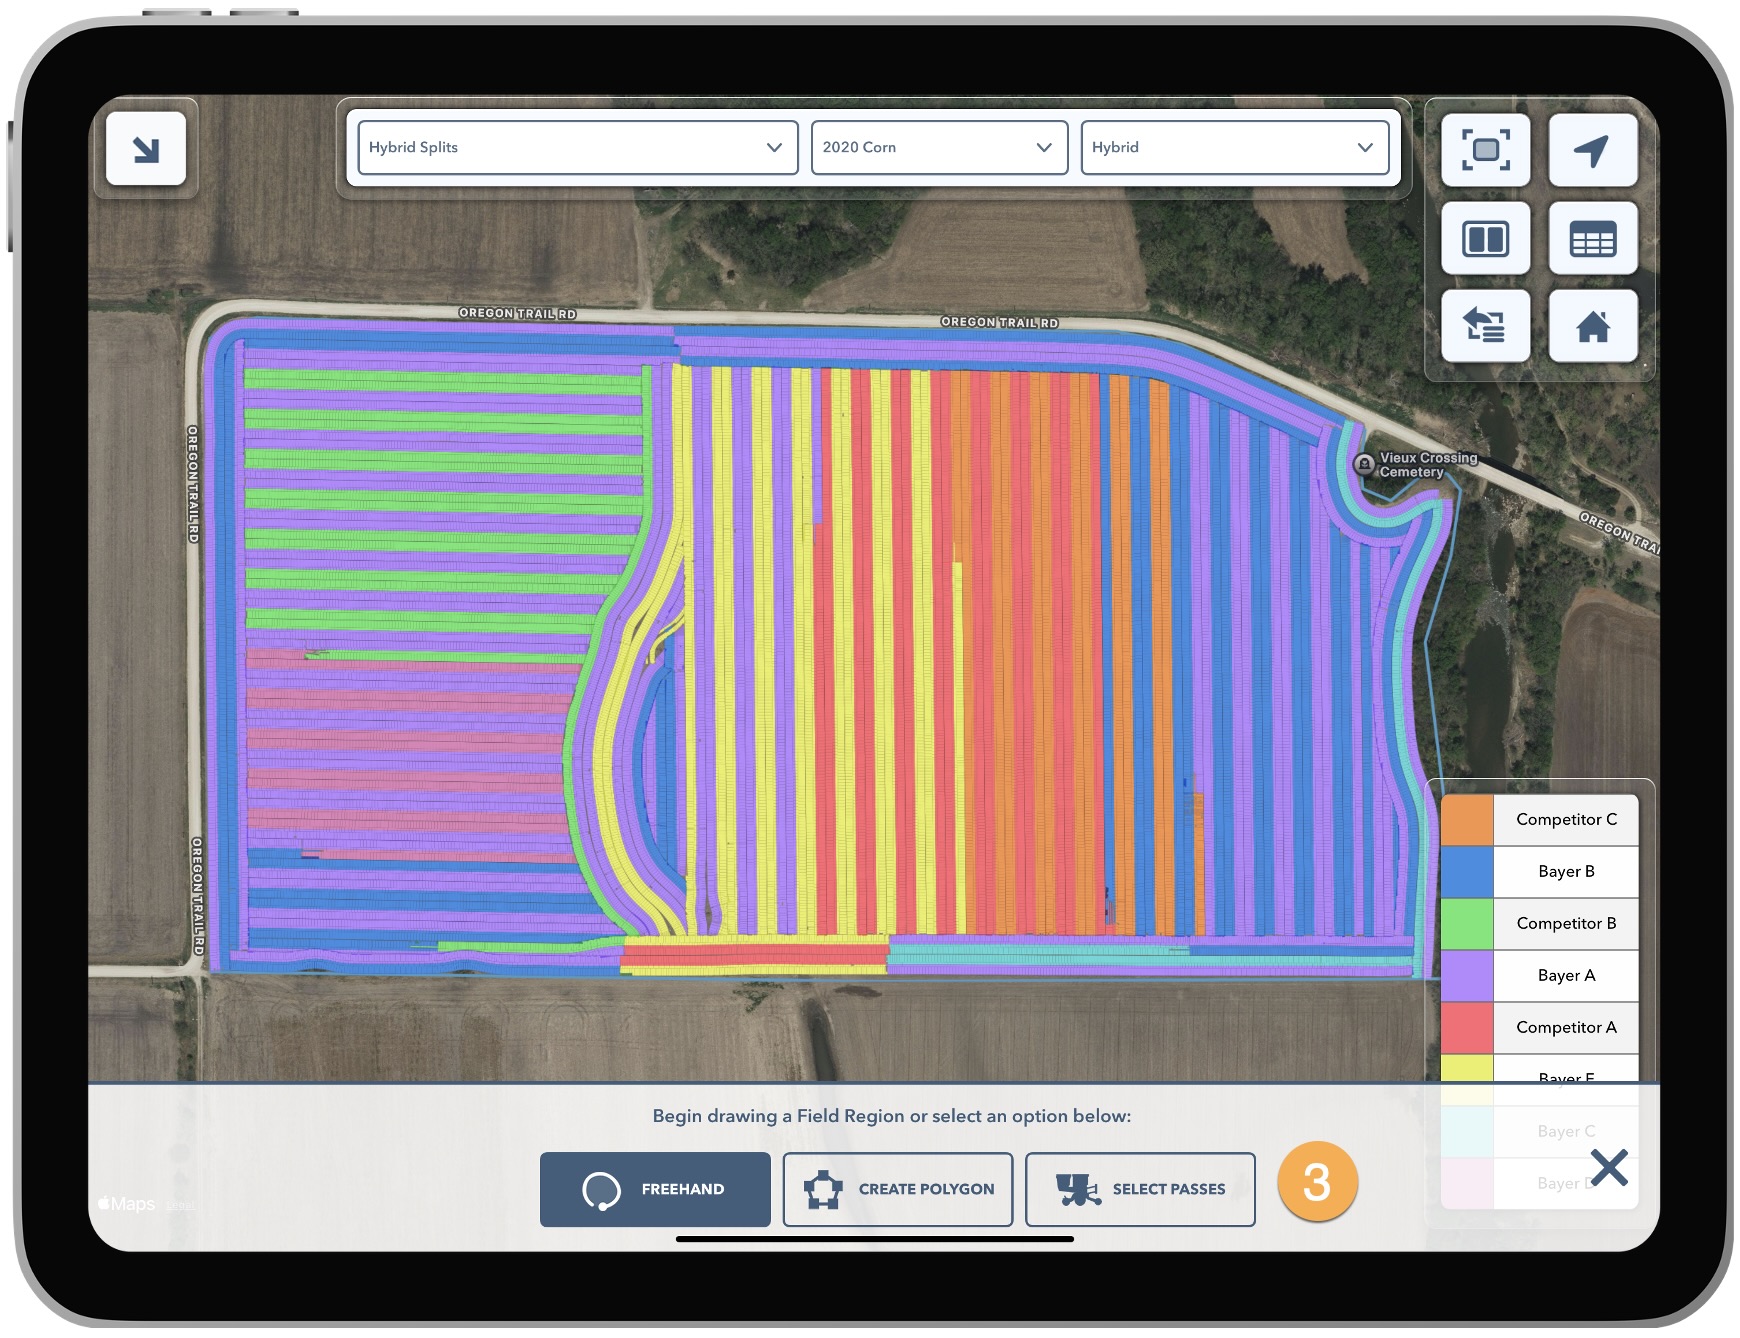
3. Tap Freehand, Create Polygon, or Select Passes button that appears at the bottom of the map screen.
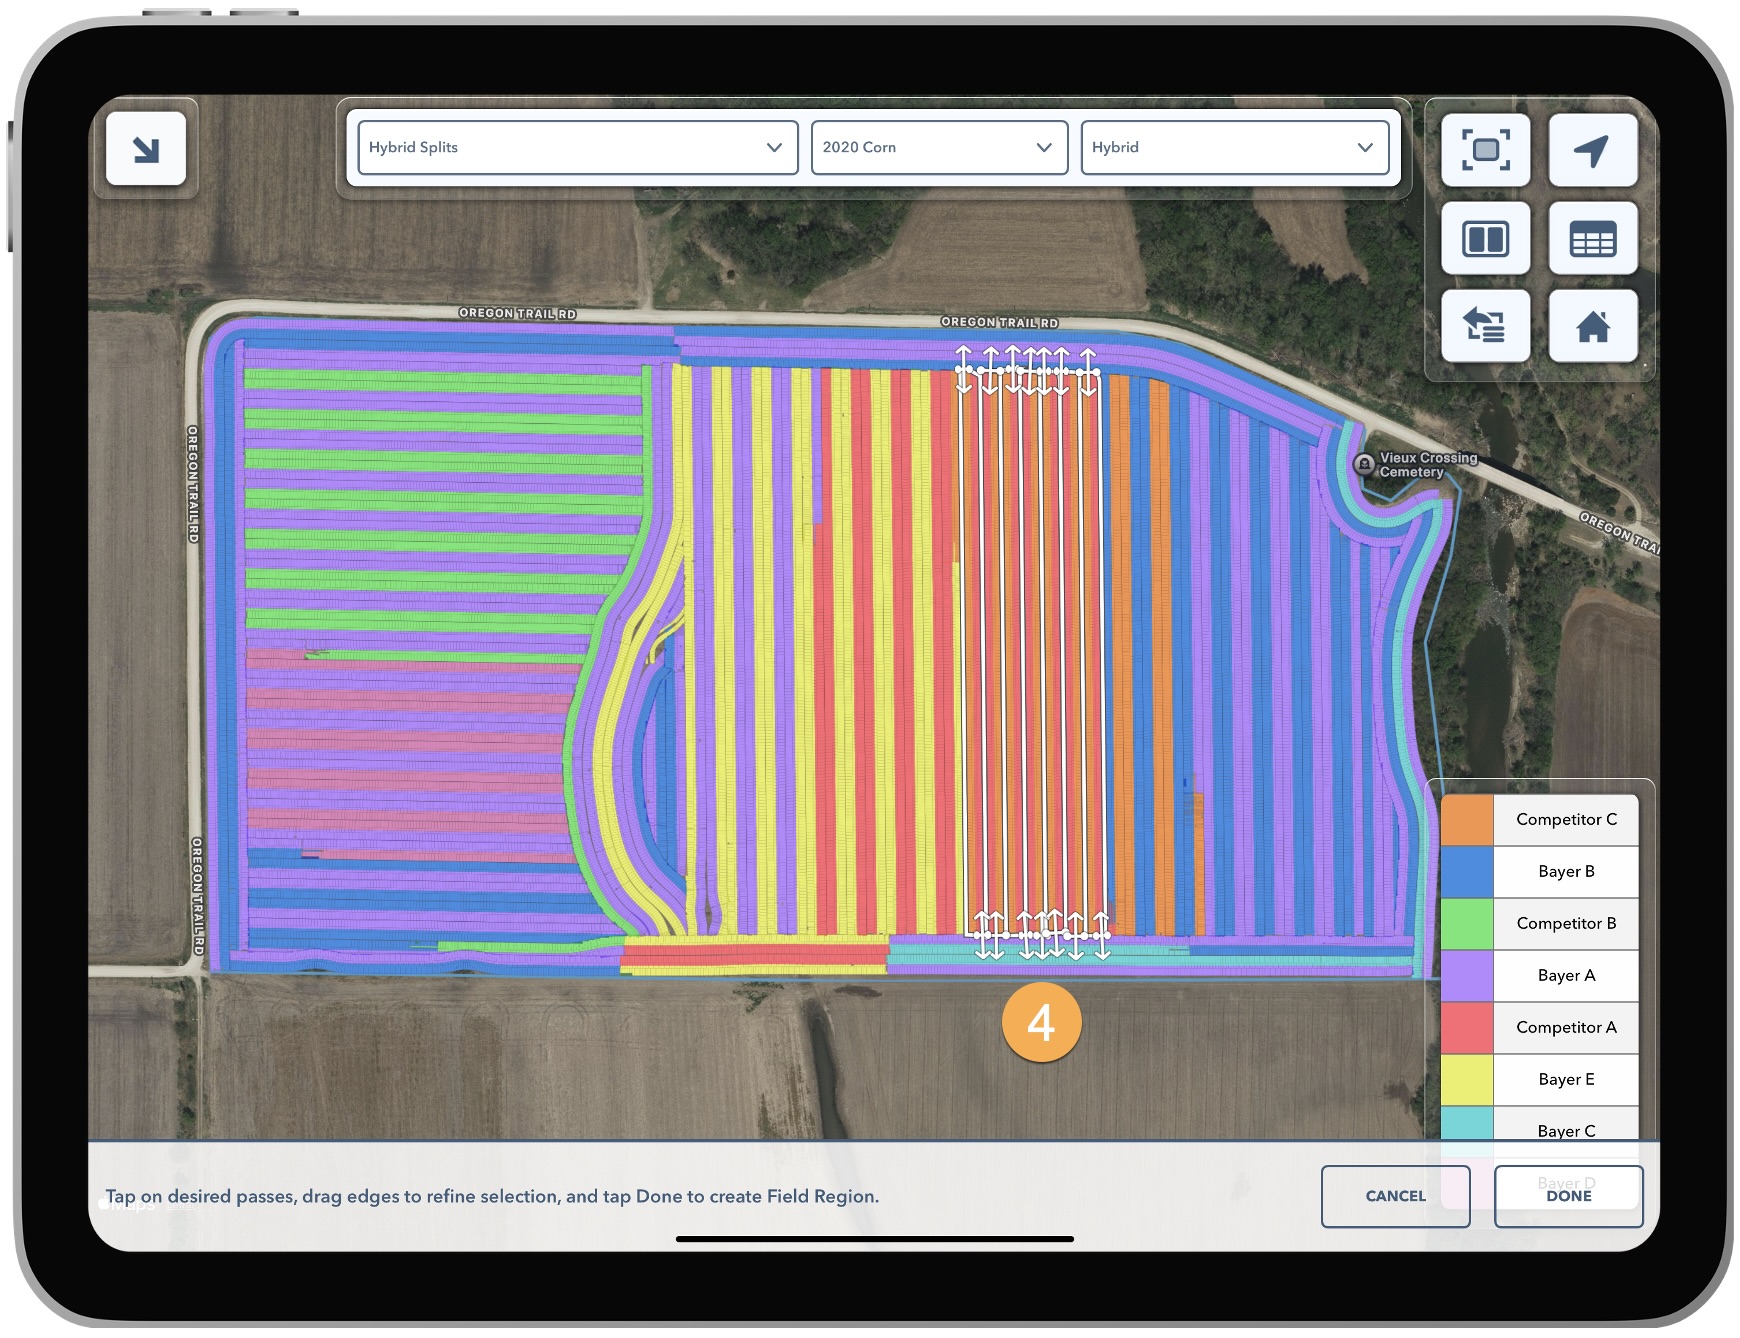
4. If selecting passes, tap the desired passes and refine selection by dragging the ends of the highlighted passes. Tap again on to remove it from the region report.
If selecting freehand or polygon, draw field region.
Tap Done.
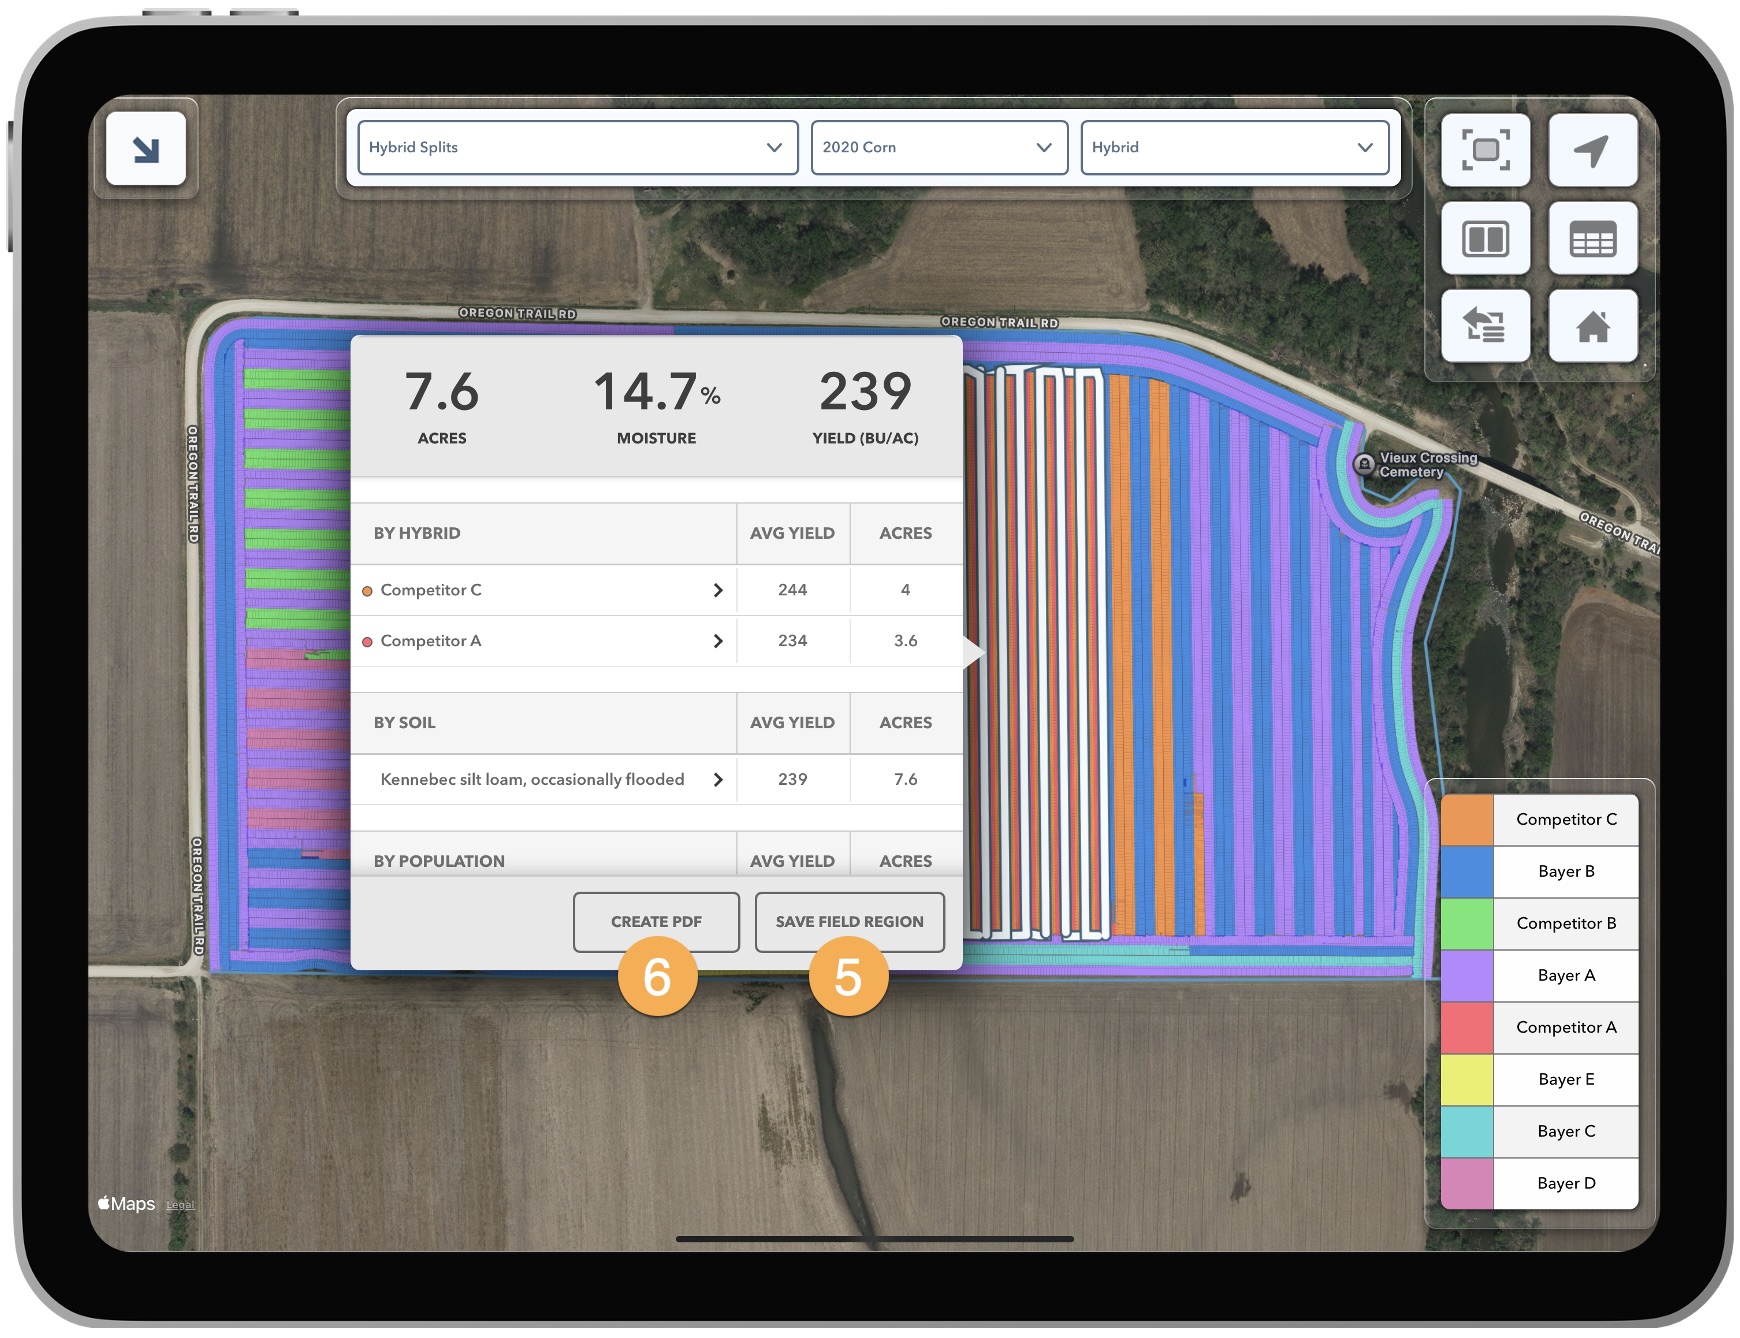
5. The Field Region Report will begin generating if yield data exists for the selected season. Tap Save Field Region. Add Notes, change the border color, set as seasonal or permanent.
6. Tap Create PDF to save or send in PDF file format.
Frequently Asked Questions Regarding Field Region Reports Online & In App
1. What is Field Region Report?
The Field Region Report feature is a powerful tool for better understanding field variability and analyzing seed performance in specific field regions. The report includes yield, hybrid/variety planted, soil types, population, and combine elevation, if available, and date of planting. The Field Region Report can be utilized within the fieldview.com website, the FieldView app, and the FieldView™ Cab app.
2. How does the Field Region Report work?
You can create a Field Region Report simply by drawing over the top of a field map image to select a specific region within your field to review your crop performance data.
3. Where is the Field Region Report Located?
FieldView App - Field Region Report is located within the Fields Screen. Use the Fields icon located at the bottom of the Overview page to enter into the Fields Screen product area.
FieldView Cap App - Field Region Report is located within the Map Screen. Use the More button located in the upper right from the Map page to create a Field Region Report.
fieldview.com - Field Region Report is located on the Fields Screen. Use the Fields tab located at the top left to enter the Fields Screen and select a field.
4. Can I use the Field Region Report on any other image besides my yield map?
Any map layer with associated yield data, located within the Fields Screen, will provide you the ability to run a Field Region Report.
5. How can I measure hybrid or variety performance?
Simply create a Field Region Report for selected areas within your field for analysis. You can also use Yield Analysis for whole field performance data.
6. What is needed for me to utilize the Field Region Report?
To start, you will need internet connection for the Field Region Report to run. To get the most robust results and field insight out of Field Region Report, both planting and harvest data should be captured. If you have only captured harvest data, you can still utilize Field Region Report but the report will only show yield data by soil type. If you need to import other data layers, utilize our Import feature on fieldview.com.
7. Can I share the Field Region Report?
Yes, Field Region Report can be shared by text or email. Additionally, saved Field Regions are automatically shared to those who have shared access to the field in which it is drawn.
8. If I have planted more than one hybrid/variety in a field, how can I review the harvest performance data of just one of them?
The Field Region Report will allow you to hand select which areas of a field you want tor review harvest performance data. This will enable you to select areas within a field that you have planted different hybrids/varieties. The best way to do this is by using the SplitView function where you can review your hybrid/variety planting map and yield map at the same time while also using Field Region Report to select the areas that interest you. After running the Field Region Report, you can drill down even further by clicking on the hybrid/variety within the Field Region Report to view how that hybrid alone performed within the selected area.
9. Can I use Field Region Report while in SplitView?
Yes. Field Region Report is available in SplitView giving you the opportunity to review additional information while you examine more than one field map image at the same time.
10. My Field Region failed to generate a report. Why did this happen?
This is likely due to one of the following reasons:
The select field does not have harvest data for the selected season.
The iPad® device does not have an internet connection (cellular or wifi)
The iPad is currently connected to a Drive or a 20|20
RemoteView is currently being used