Field Region Report (FRR) by Crop Protection Application in FieldView App
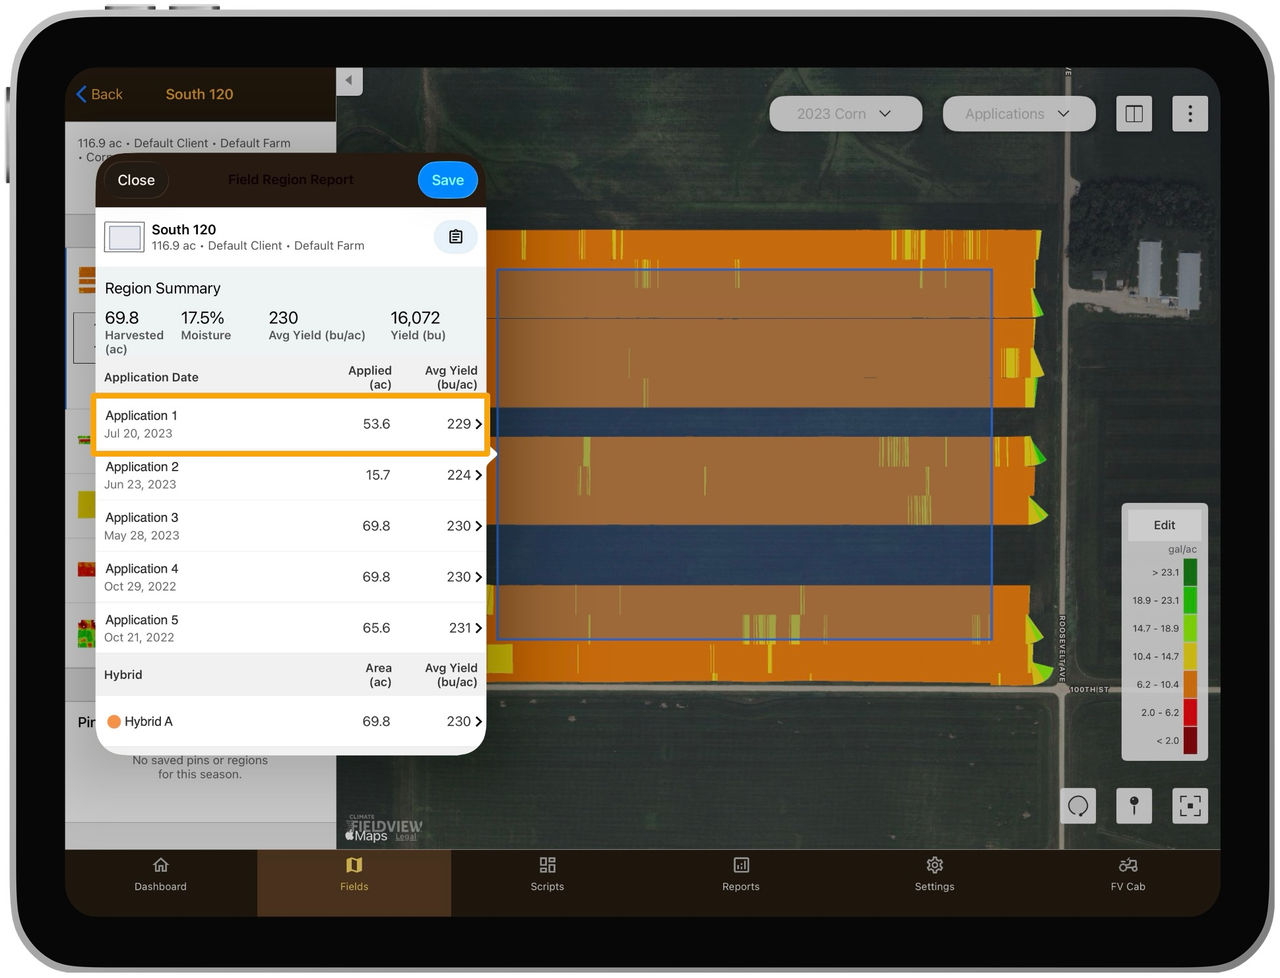
Field Region Report by application allows customers to identify a region with the field and then create a report that shows the yield data by each application tank mix that was applied with the region selected.
Why Use Field Region Reports in FieldView App?
- Identify the best performing products on your farm with Field Region Reports
- Evaluate your crop protection investments by visualizing the impacts to your yield in Field Region Reports
- Plan, execute, record, and analyze applications with your yield data in Field Region Reports
How to Create a Field Research Report by Crop Protection Application in the FieldView App:
1. Navigate to the FieldView™ app

2. Click on the Fields tab and select the field you want to run the report on
3. Select the Field Region icon located in the bottom right corner of the screen

4. Once you draw the Field Region, you will be able to analyze the applications in the report, showing the applied acres as well as the average yield
5. Click on the application to dive deeper into the analysis
FieldView App Field Research Reports by Crop Protection Application Includes:
- Application name with date applied
- Number of acres within the selected area that tank mix was applied on
- Average Yield for each application with the selected region
Viewing FieldView App Field Research Reports by Application Rate:
- Drill down by specific application to include yield for area applied within the region and area not applied within the region drawn
- Application Rate will break down the yield for the selected area by the different applied rates providing a way to evaluate how different crop protection and fertility rates impact yield
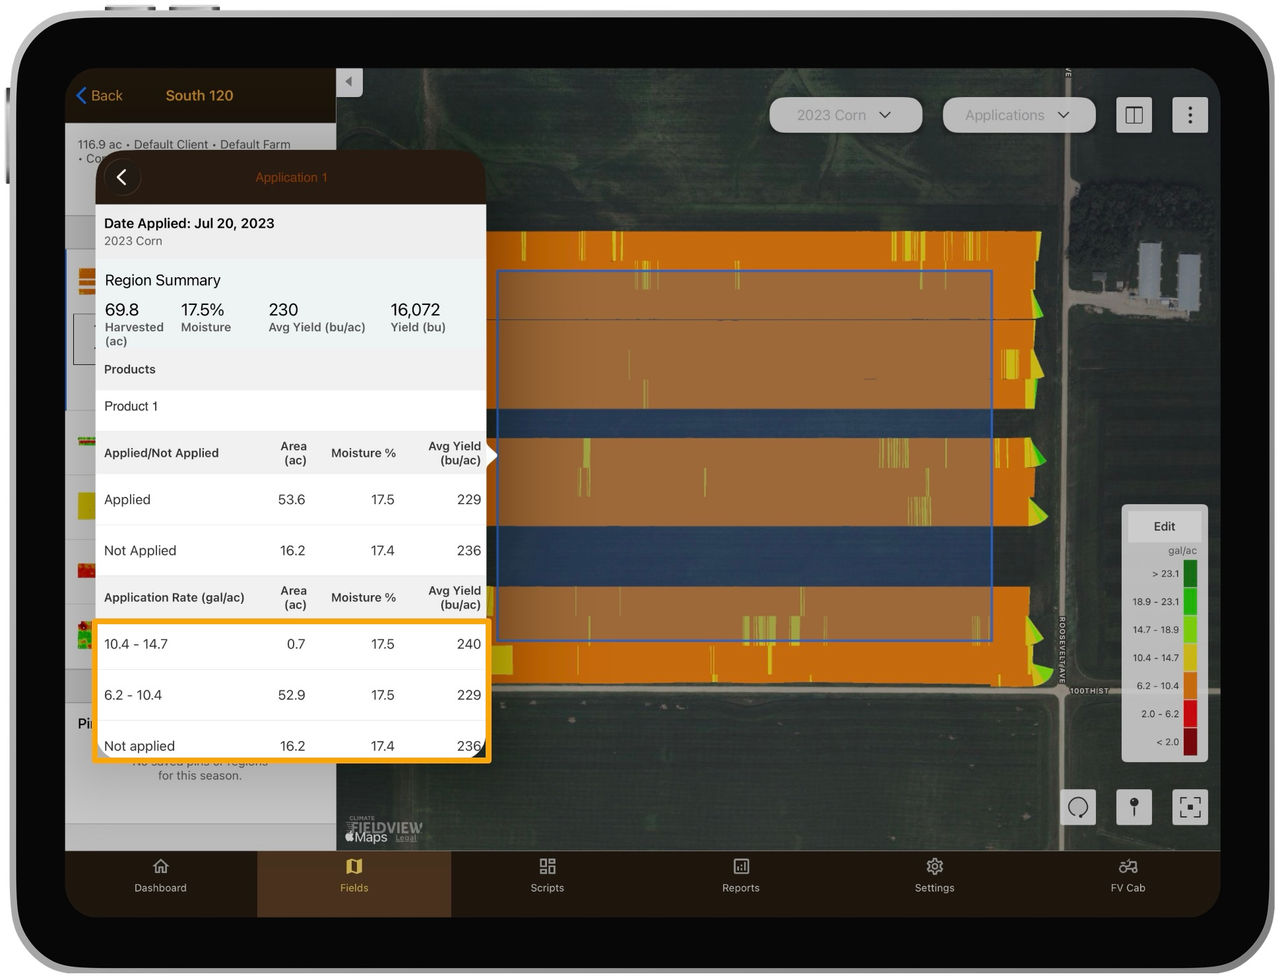
- Validate the impact of different application rates on yield with the Field Region Reports by Application Rate. This data-driven approach allows you to fine-tune your application rates, based on specific growing conditions and weed pressure in a selected field region.
- Every field has unique characteristics that positively or negatively contribute to yield. Field Region Reports by application allow you to identify those zones and create a field region report. Gaining insights on subfield data through comparative yield analysis of application data.