FieldView 201

Now that you have your account set up, fields mapped, and your equipment set up, let’s start capturing data and put it to work for your operation. FieldView™ enables you to collect planting, harvest and spraying application data. Once your data is collected, you can then analyze it to see what’s working on your operation — and what isn’t.

Getting Started

Planting

With your FieldView™ Drive or Precision Planting 20/20 SeedSense®, seamlessly collecting planting data is simple.

Follow this checklist to get started collecting planting data:

  • Confirm your equipment is compatible with FieldView Drive.
  • Confirm that your FieldView™ Drive is connected via Bluetooth® to your iPad® device by verifying that the light on the FieldView Drive is blue.
  • If using a Precision Planting 20/20 SeedSense, confirm Precision Planting 20/20 SeedSense® software is updated. Find the most recent software at: http://www.precisionplanting.com/#support/
  • Pre-load hybrids and seed treatments.
  • Confirm the correct field boundary when entering each field. This can be done three different ways:
    • When moving to a different field be sure to change the Active Field using the Map Selector.
    • When Field Boundary Detection is enabled, a prompt to change fields will appear when entering a field boundary.
    • When Field Boundary Detection is set to Auto in Map Options, FieldView™ Cab app will automatically change the Active Field that data is being collected in when entering a new field boundary.
  • If you want to create and implement planting prescriptions with FieldView, we will cover that in FieldView 301.


Please review the full planting checklist here for more information. If you need additional help, contact our support team at 1-888-924-7475 and they’ll help you get set up.

Spray Applications

Follow these simple steps to start collecting application data with the FieldView™ Drive:

  • Confirm your equipment is compatible with the FieldView Drive.
  • In the FieldView™ Cab app, navigate to Settings > Applications. Tap “Add New Application” and enter a name that will uniquely identify this application. This name can be changed at any point in the future.  
  • Select whether the products that will be applied are "Granular" or "Liquid".
  • When the Setup page opens, use the control in the upper right to select whether products will be entered “By Rate” or “By Amount”.
  • Enter Products “By Rate” if you would like to enter the amount of each product that will be applied per acre. When entering “By Rate,” it’s necessary to enter the Application Base Rate.
  • Begin adding Products by tapping “+ Add Product” and entering the name of a product.
  • Select from the list of common products or tap “+ Add Custom Product” to a add a product not included in the list.
  • After adding the product, enter the rate or amount of that product that will be applied.
  • Repeat for each product in the application and tap “Done”.


Please review the full application checklist here for more information. If you need additional help, contact our support team at 1-888-924-7475 and they’ll help you get set up.

Harvest

With your FieldView™ Drive or Precision Planting 20/20 YieldSense, seamlessly collecting harvest data is simple.

Follow this checklist to get started collecting harvest data today with FieldView Drive:


  • Confirm your equipment is compatible with FieldView Drive.
  • Confirm that your FieldView Drive is connected via Bluetooth® to your iPad® device by verifying that the light on the FieldView Drive is blue.
  • From the FieldView™ Cab app home screen, tap on the Map icon.
  • When entering a field, you will be prompted to change the active field if the Field Boundary Detection is enabled (the FieldView Cab app uses Field Boundary Detection to prompt operators to switch fields when entering a new field boundary).
    • A pop up will appear asking if you would like to make the current field the active field. Select “Yes”.
    • Confirm or select correct crop and adjust Crop Settings if necessary, tap “Done”.
    • Verify Head Height is properly set.
  • To end a field when harvesting, FieldView Drive will detect that the separator is off or that the combine head is in a raised position (provided head height is properly set) and end data collection for that field.
  • Be sure to stay connected to the FieldView Drive until data is offloaded completely to the FieldView Cab app. You can check this by navigating to Settings > Devices > Edit on connected device > Offload Status page > Check overall offload status progress or individual field progress.


Please review the full pre-harvest checklist here for more information. If you’re collecting harvest data using the Precision Planting 20/20 YieldSense, contact our support team at 1-888-924-7475 and they’ll help you get set up.

Data Visualization

In-Cab Real-Time Data Visualization

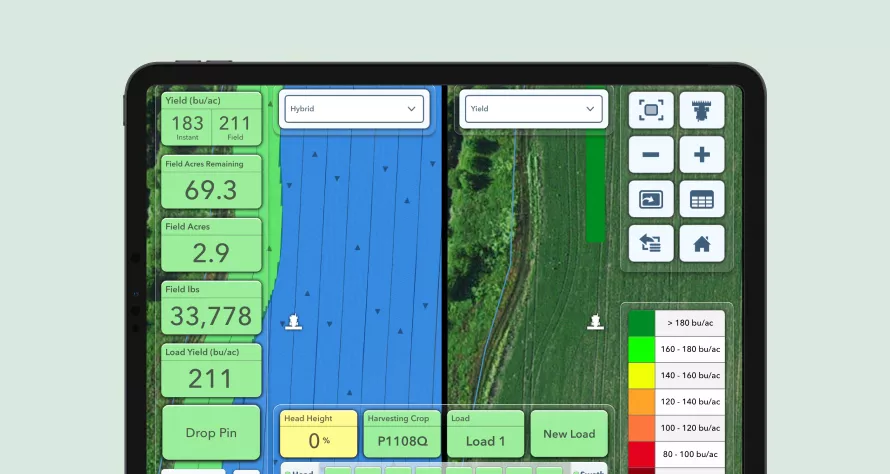
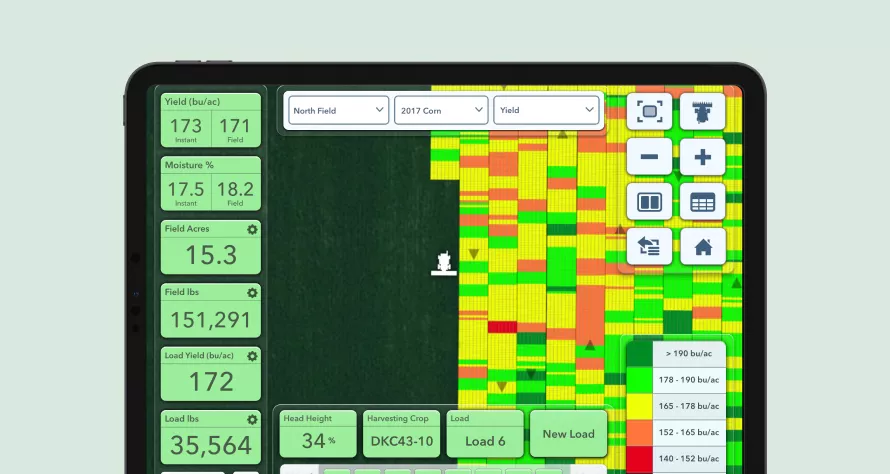
With the FieldView Cab app, you can watch your maps build in real time as you pass through the field. With this visualization, you can track seed population rate while planting and yield while harvesting and spot potential issues like excessive downforce while planting, a clogged nozzle while spraying, or high moisture during harvest, in order to protect yield and get the most out of every crop. If you followed the steps for harvest, planting and spraying, you will be able to view your progress for each of these passes in the FieldView Cab app.


Example of Harvest Collection

You also have the ability to visualize multiple data layers in the FieldView Cab app in real time as you make passes through your field. Open the FieldView Cab app on your iPad®:

  • While you’re viewing your real-time data in the FieldView Cab app, tap on the Side-by-Side icon in the top right-hand side of the screen.
  • From the drop-down menus, select the data layers you want to view in real time - such as hybrid and yield data - while you’re in the field harvesting.

RemoteView

RemoteView in the FieldView Cab app offers the ability to see activity as it’s happening in the cab - even if you’re not in it - from anywhere. This provides an easy and powerful way for everyone within an operation to be aware of exactly what is happening. Here’s how you do it:

  • Tap on the FieldView Cab app icon on your iPad®.
  • Tap on the Equipment icon, and you will see the list of all planters, tractors, combines, and sprayers in the operation. The equipment that is currently connected to FieldView Cab app on an iPad and has an internet connection will be available for RemoteView. Begin a session by tapping the RemoteView button next to the desired Equipment in the list.

During the RemoteView session, the real-time data from the connected equipment will begin being mapped and reported in the Metrics Pane (green boxes on the left of the screen), as seen below. Changing the current map type being viewed, editing the legend, or opening a report will not impact what the operator is seeing on their iPad.

The name of the equipment being viewed using RemoteView will be displayed in the middle of the Map under the Map Selector, as will a Disconnect button that will end the current RemoteView session.

Additional resources:

Put Your Data to Work

If you have data in your FieldView account, we’re going to show you how to put it to work so you can get the most out of every acre. If you were unable to stream data via the FieldView Drive or your Precision Planting monitor, don’t worry, FieldView still offers ways to add your field data into your account. Please reference this information on uploading historical data.

Yield Analysis

Harvest is where all your hard work you put in throughout the year really pays off. The yield analysis tool allows you to see that harvest data you collected so you can analyze your yield by field, soil, or seed type so you can make the best agronomic decisions next season.


  • Open the FieldView™ app and select the Overview tab (bottom left).
  • Review the Yield Analysis status box for a snapshot of the most recent results.
  • Tap on the crop you would like to analyze. Confirm the correct operation, crop and year (upper right).
  • Select the Field, Hybrid/Variety or Soils tab to specify your report type.
  • Sort your data by Field Name, Avg. Yield, or Harvested acres and tap any row for more detail.


For more information on yield analysis, click here or watch this short video.

Side-by-Side Maps

See how your agronomic decisions impacted yield by comparing critical data layers such as soil maps, application rate, and seed population to yield with side-by-side maps. In the FieldView app, follow these steps:

  • From the Overview screen tap on “View More”.
  • Tap on the field map you want to view.
  • Select “Scouting” or “Vegetation”.
  • Tap on the Side-by-Side icon (top right).
  • Using the drop-down menus, compare and analyze your map layers, such as comparing hybrid to yield.

You can also do a side-by-side comparison in the the FieldView Cab app by following these steps:

  • Open the FieldView Cab app on your iPad device.
  • From the home screen tap on the Map icon.
  • From the dropdown menus, select the field you want to perform a side-by-side analysis on, the year and crop you want to review and the data you want to look at (planting, in-season, harvest, and base layers).
  • Tap on the Side-by-Side icon (top right).
  • In the drop-down menu, compare and analyze your map layers, such as comparing yield to hybrid.
    • Note: You can also utilize the side-by-side view while you are in the cab to view one map layer against the real-time mapping occurring during your field activity.


Field Health Imagery

Find out what’s happening beyond the end rows with consistent, high-quality imagery. Scouting maps help you identify issues early, prioritize scouting and take action to protect yield. Vegetation maps help you monitor biomass over time and feature advanced color mapping to provide a higher level of image detail. True color images provide a real-world view of your fields, so you can compare this view to vegetation and scouting maps. Here’s how you find your field health images:


  • Open the FieldView app.
  • On the Overview screen, tap on “Field Health”.
  • Select the field you want to analyze.
  • Then select the dated image from that field you want to analyze.
  • At the top left of the screen you can select either "Scouting" or "Vegetation".
  • If you want to look at a True Color representation of your screen, just tap on “True Color” (bottom right).

Scouting Maps

Scouting maps provide an accurate representation of field conditions, and enable you to focus on key areas within a field.

Vegetation Map

Vegetation maps allow for easy tracking of field progress and health through the season. The map is colored using the Climate Crop Index, which calculates current vegetative biomass.

True Color Map

True color images provide you the ability to see a real-world view of your field, which is helpful to compare to your Scouting and Vegetation images, as well as to find impediments such as clouds or shadows.

Additional resources:

Drop and Save Pins

When using field health imagery, dropping and saving pins is critical. It enables you to locate a specific spot that needs attention and save that location, making it easy to continue to scout that area all season long.

Here’s how to use pins:

  • On the Overview screen of the FieldView app, select “Field Health”.
  • Select the field you want to analyze.
  • Select the dated image from that field you want to analyze.
  • From either your scouting map or vegetation map layer, tap on the Pin icon to drop a pin on your map.
  • The dropped pin will allow you to enter a description, note and photos, make the pin seasonal or permanent, and tag your pin with an issue and the specific coordinates on your map. You can even color code your pins.
  • Then tap “Save” to save your pin.
  • You can also share the pins you saved in your fields with your business and agronomic partners so they have all of the information about your fields in one place to make the best recommendations. Please reference the Sharing section below for how to share your fields with your trusted partners.

Field Region Reports - Saved Regions

With FieldView you can save certain regions of your field where you want the ability to track - such as test plots or spots on your scouting map where you’ve identified issues. You can monitor those regions throughout the season, measuring the impact your decisions had on yield, and integrate those insights from year to year.


Saving Regions:

  • On the Overview screen of the FieldView main app, select “Field Health”.
  • Select the field you want to analyze.
  • Select the dated image from that field you want to analyze.
  • From either your scouting map or vegetation map layer, tap on the Drawing Tool icon   to draw your region in either circle, freeform, polygon or rectangle.
  • The region will show you harvest data, soil type, population, elevation, and planter date.
  • Enter a description, photos, or tag your region by tapping on “Add a note”.
  • Then tap “Save” to save your region.

Summary Reports

In the FieldView Cab app, you can view Summary Reports for Planting, Harvest and Application. For this example, let’s walk through a Harvest Summary Report.

  • Open the FieldView Cab app on your iPad.
  • From the home screen tap on the Map icon.
  • Choose the field you want to run a summary report on, choose the year, then tap on the third drop down and select the harvest event you want for your report.
  • Tap on the More icon   and select “Harvest Summary”.
  • From here, you can create a map PDF and share with your agronomic partners or print a copy by tapping on “Create Map PDF” at the top right of your report. Then tap “Email/Print”, and choose the icon for your preferred next step.
  • You can follow the same steps to create a planting or application report by selecting the corresponding map layer in the third drop-down menu after you have selected the field on which to run a report, or click here for more information.
  • In addition to the Summary Reports, we also offer a Season Summary Report, which provides an overview of every planting, application, tillage, and harvest activity performed in a field across the selected season. It provides quick access to the Summary reports for these activities, as well as the ability to add missing activities and create a printable PDF report that includes all the key details for each activity.

Follow the first four steps above, and on step five, choose Season Summary Report or click here for a step-by-step process.

Print Maps and Reports

We’ve been talking a lot about maps in this section and how you can view them electronically, but what if you want a hard copy to print out or share with your agronomic partners? We have that too. Here’s how you do it.

  • How to print and share maps in the FieldView app
    • Open up the Fieldview app.
    • Tap on Fields (bottom toward left).
    • Tap on the field you want to print a map and report for, and use the drop-down menu to select the map layer you want to print/share.
    • Tap on the Map Options button (top right). 
    • Select “Create PDF Report”.
    • You can then add a note to your report, and click “Next”.
    • Then tap on the Send icon. 
    • From there, you can print or share your map and report.
    • If you need more information, please review this short video to walk you through the steps for sharing and printing maps and reports.
  • How to print and share maps in the FieldView Cab app
    • Open the Fieldview Cab app.
    • Tap on the Map icon.
    • Use the drop-down menus to select the field, year/crop and map layer (Planting, In-Season, Harvest, Base Layers) you want to print a map and report for
    • Tap on the More icon   and select “Share/Print”
    • From there you can share field files via email and create a printable PDF Map for printing and sharing with your agronomic partners
Share Fields With Your Partners

Now that you’re ready to go with Climate FieldView, you may want to automatically share your fields and data with your partners, such as your dealer or agronomist. Sharing is easy and can be done by following these simple steps. You can also share field data through the FieldView Cab app by following these steps. Sharing can be turned off at any time.

Still Have More Questions?

If you have more questions or want to dig a little deeper on what you can do with FieldView, you can search our Knowledge Center by topic by visiting climate.com and clicking on “Support” at the top of the home page. There you will find hundreds of helpful videos and how-to guides.